Whether you’re new to trading or a seasoned professional, understanding Fibonacci retracement and extension levels can sharpen your strategy.
By leveraging these mathematical ratios, derived from nature’s patterns, traders can pinpoint entry and exit points with greater precision.
This blog post will guide you step-by-step through the fundamentals of Fibonacci in forex trading, updated with the latest insights for 2025. From plotting Fibonacci levels to integrating them with other technical tools, we’ll simplify the complexities into actionable strategies.
Ready to uncover how this age-old sequence aligns with modern trading techniques? Let’s dive in and decode the power of Fibonacci in navigating the ever-evolving forex market.
What are Fibonacci Numbers and Their History?
Fibonacci numbers are a sequence of numbers that start with 0 and 1, where each subsequent number is the sum of the two preceding ones.
For example, the sequence begins as 0, 1, 1, 2, 3, 5, 8, 13, and so on. These numbers are more than just a mathematical curiosity; they represent patterns that frequently appear in nature, such as the arrangement of leaves on a stem, the spirals of a sunflower, or the structure of a seashell.

The history of Fibonacci numbers dates back to the 13th century when Leonardo of Pisa, known as Fibonacci, introduced this sequence to Europe in his book Liber Abaci. He used it to solve a practical problem about rabbit population growth, but its significance soon expanded beyond agriculture. Over time, these numbers became the foundation for Fibonacci ratios, which traders now use in financial markets to predict price movements and trends.
The beauty of Fibonacci numbers lies in their universality. From ancient architecture to modern financial analysis, they demonstrate how natural patterns can provide insights into seemingly unrelated fields. This sequence is now a cornerstone in trading, offering a reliable method to interpret market behavior with mathematical precision.
What is Fibonacci in Trading?
Fibonacci in trading refers to a set of technical analysis tools that use Fibonacci ratios to identify key levels in the market. These levels help traders analyze price behavior and forecast potential future movements. Common tools include Fibonacci retracement levels, extension levels, and more advanced patterns like Fibonacci time zones.
Fibonacci retracement is used to identify potential support and resistance levels by measuring the depth of a price correction during a trend. Extension levels, on the other hand, help traders determine where a price might move once it resumes its trend. These tools are particularly popular in forex trading but are also applied in other financial markets.
By incorporating Fibonacci tools into their strategies, traders can identify optimal entry and exit points and manage risk more effectively. The mathematical foundation of these tools adds a layer of precision, making them a valuable resource for technical analysis in trading.
Key Fibonacci Tools for Forex Traders
Forex traders rely on Fibonacci tools to analyze market trends and identify trading opportunities. These tools use mathematical ratios to highlight key price levels where trends may reverse or continue. The main Fibonacci tools that traders commonly use include:
1. Fibonacci Retracement:
This tool helps traders determine potential support and resistance levels during a market correction. By drawing retracement lines between a significant high and low, traders can identify levels such as 23.6%, 38.2%, 50%, and 61.8%. These levels indicate where the price may pause or reverse, helping traders decide when to enter or exit a trade.
2. Fibonacci Extension:
Extension levels are used to forecast potential price targets beyond the current trend. They are typically drawn after a retracement and provide traders with zones where the price may continue its movement. Levels like 127.2%, 161.8%, and 261.8% are frequently monitored for take-profit points.
3. Fibonacci Arcs:
Fibonacci arcs are curved lines drawn from a high to a low (or vice versa) that show potential support and resistance areas. These arcs visually represent zones of possible price interaction based on time and price movement, helping traders predict future trends.
4. Fibonacci Fans:
A Fibonacci fan consists of diagonal lines extending from a high or low point to indicate potential trend lines. These lines help traders identify dynamic support and resistance levels during trending markets.
5. Fibonacci Time Zones:
This tool focuses on timing rather than price. It divides a trend into time intervals using Fibonacci ratios, helping traders anticipate when significant price movements might occur.
Each of these tools serves a specific purpose and can be combined with other technical indicators for more reliable analysis. Mastering them allows traders to approach the forex market with greater confidence and precision.
Using Fibonacci Retracements to Enter Trades
Fibonacci retracement is one of the most popular tools for identifying potential entry points in trading. It helps traders locate areas where the price might reverse or consolidate, offering valuable insights into market behavior. The retracement levels are derived from key Fibonacci ratios such as 23.6%, 38.2%, 50%, and 61.8%, which act as potential support and resistance zones.
For example, as you can see in the image below of the gold chart on the one-hour timeframe of the Trendo trading platform, the gold correction has encountered a good resistance reaction at the 61.8 level, and the continuation of the downward movement of gold has begun:
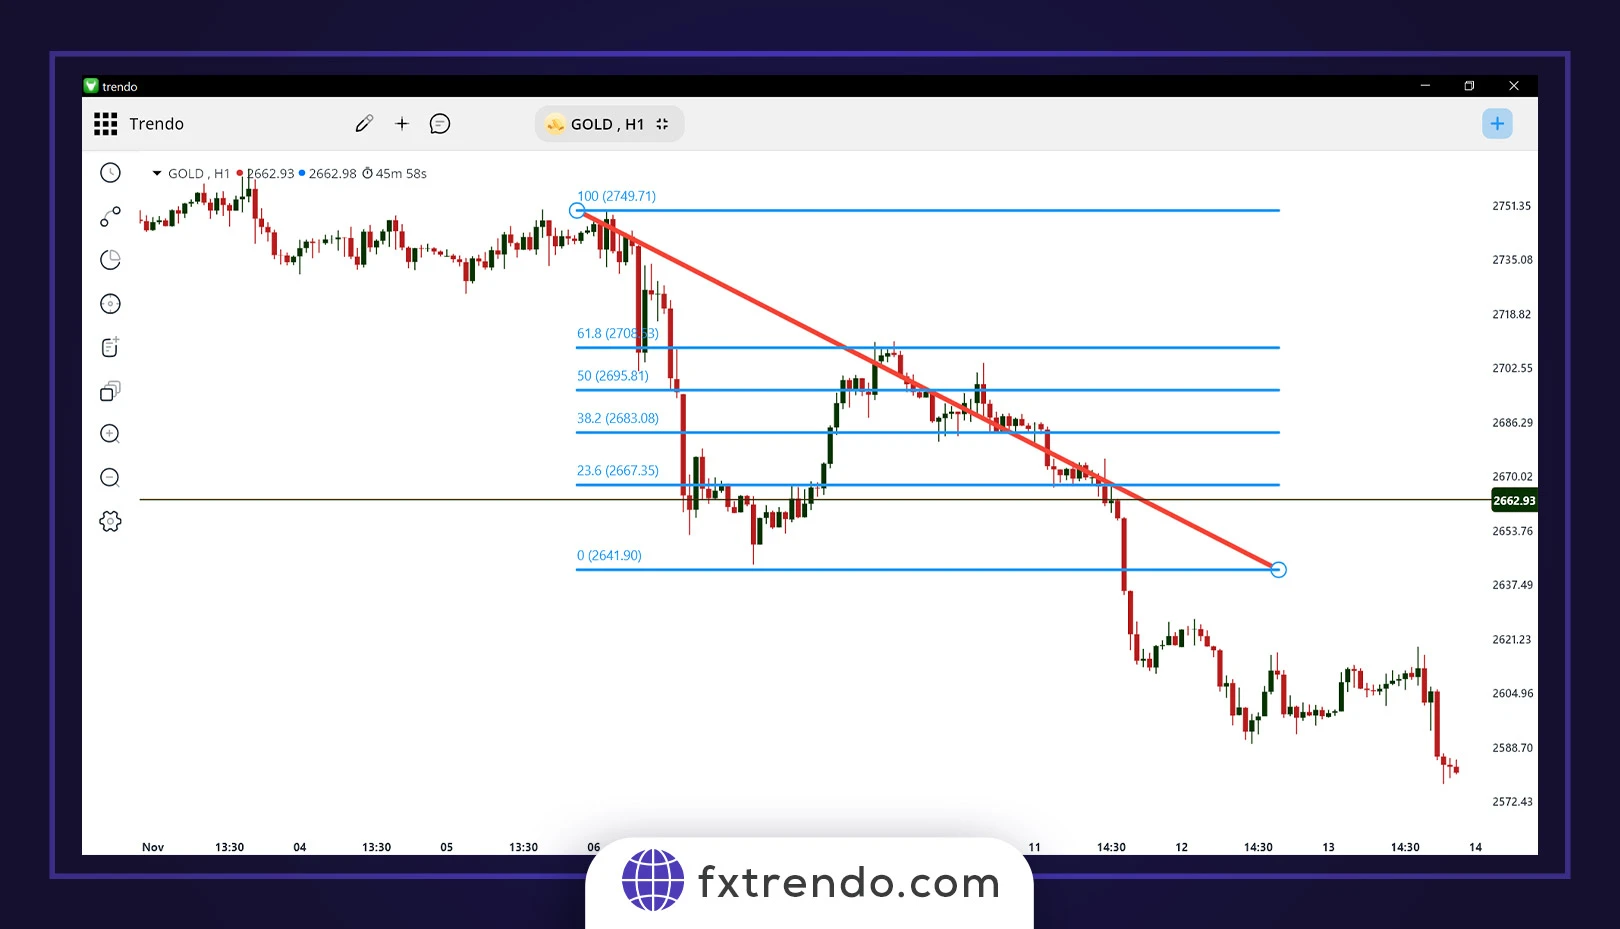
To apply this tool effectively, traders draw Fibonacci retracement lines from the recent high to the low (in a downtrend) or low to high (in an uptrend). Once the retracement levels are plotted, they monitor price action at these levels for confirmation signals, such as candlestick patterns or volume changes, before entering a trade.
Using Fibonacci Extension in Trades
Fibonacci extension is a tool used to identify potential price targets after a trend has retraced and is ready to resume. Unlike Fibonacci retracement, which focuses on finding support and resistance during a correction, Fibonacci extension helps traders predict where the price might go once the trend continues.
The key Fibonacci extension levels are 127.2%, 161.8%, and 261.8%. These levels often act as targets for the continuation of a trend.
The Fibonacci extension tool works based on market psychology. For example, during a correction, many traders are psychologically inclined to trade against the correction when the price reaches around the 61.8% retracement level. This level is significant because it represents a common point where traders expect the trend to reverse, which can lead to increased buying or selling pressure.
Professional traders and financial institutions often focus on these Fibonacci levels, which is why price tends to react at these levels repeatedly.
By using Fibonacci extension, traders can set more informed price targets, improving the accuracy of their trades. This approach allows for better entry and exit points, helping to manage risk more effectively and enhancing the potential for profitable trades.
Key Fibonacci Levels in Trading
Fibonacci numbers act as essential tools for traders, helping them understand and predict price behavior in the market. These key levels often highlight where price action is likely to react, guiding traders in making informed decisions. Each level carries a specific meaning, reflecting a natural order in market behavior. Here’s a breakdown of the most important Fibonacci levels in trading:
23.6% Level:
The 23.6% retracement level represents a quick price movement and often marks the initial reaction point in the market. It’s typically where the price might show a minor pullback before continuing the trend. Traders consider this level for early signals of a reversal or continuation.
38.2% Level:
The 38.2% level is often the first major retracement level traders watch for price corrections. It is considered a significant level where the market may find support or resistance, leading to a potential continuation of the original trend.
50% Level:
Although the 50% level isn’t directly derived from the Fibonacci sequence, it is widely respected in the market. Traders use it as a psychological level where the market often finds balance between the previous price swings. It serves as a key reference for potential reversals.
61.8% Level (Golden Ratio):
The 61.8% level, also known as the Golden Ratio, is the most powerful Fibonacci level in trading. It often results in strong reactions from the market, acting as a major turning point. Many traders rely on this level to identify significant entry or exit points due to its historical accuracy in predicting price reversals.
78.6% Level:
The 78.6% level represents the final attempt for a market to return to the original trend. When price reaches this level, it suggests that a deeper correction may be over, and the trend could resume. It’s a strong level of support or resistance before a trend continuation.
Each of these Fibonacci levels reflects a unique phase in market behavior, helping traders anticipate where price action might pause or reverse. By understanding and applying these levels, traders can better navigate the market and make more precise trading decisions.
Read more:
What is Stop Loss? (Importance of Stop Loss in trading)
Using Fibonacci Retracements to Enter Trades
The strategy we’re discussing here is applicable not only in the forex market but also in other financial markets like stocks, commodities, and cryptocurrencies. This approach is a trend-following strategy that aims to identify the end of corrective price movements within a trend. As mentioned earlier, Fibonacci levels highlight important support and resistance points that draw the attention of many traders. Here’s how you can apply this strategy:
Step 1: Identify the Major Initial Movement
Start by waiting for a strong trend to form and identify a significant price move. The goal is to enter the market after the price corrects, aligning with the overall trend. Recognizing trends is the most critical skill for any trader, and it requires practice and experience.
To identify the trend, various tools can be used, but it’s recommended to rely on Dow Theory, which is simple yet powerful and effective. Look for a series of higher highs and higher lows in an uptrend or lower highs and lower lows in a downtrend. To learn more about this topic, you can refer to the article “What is a Trending & Ranging Market?”
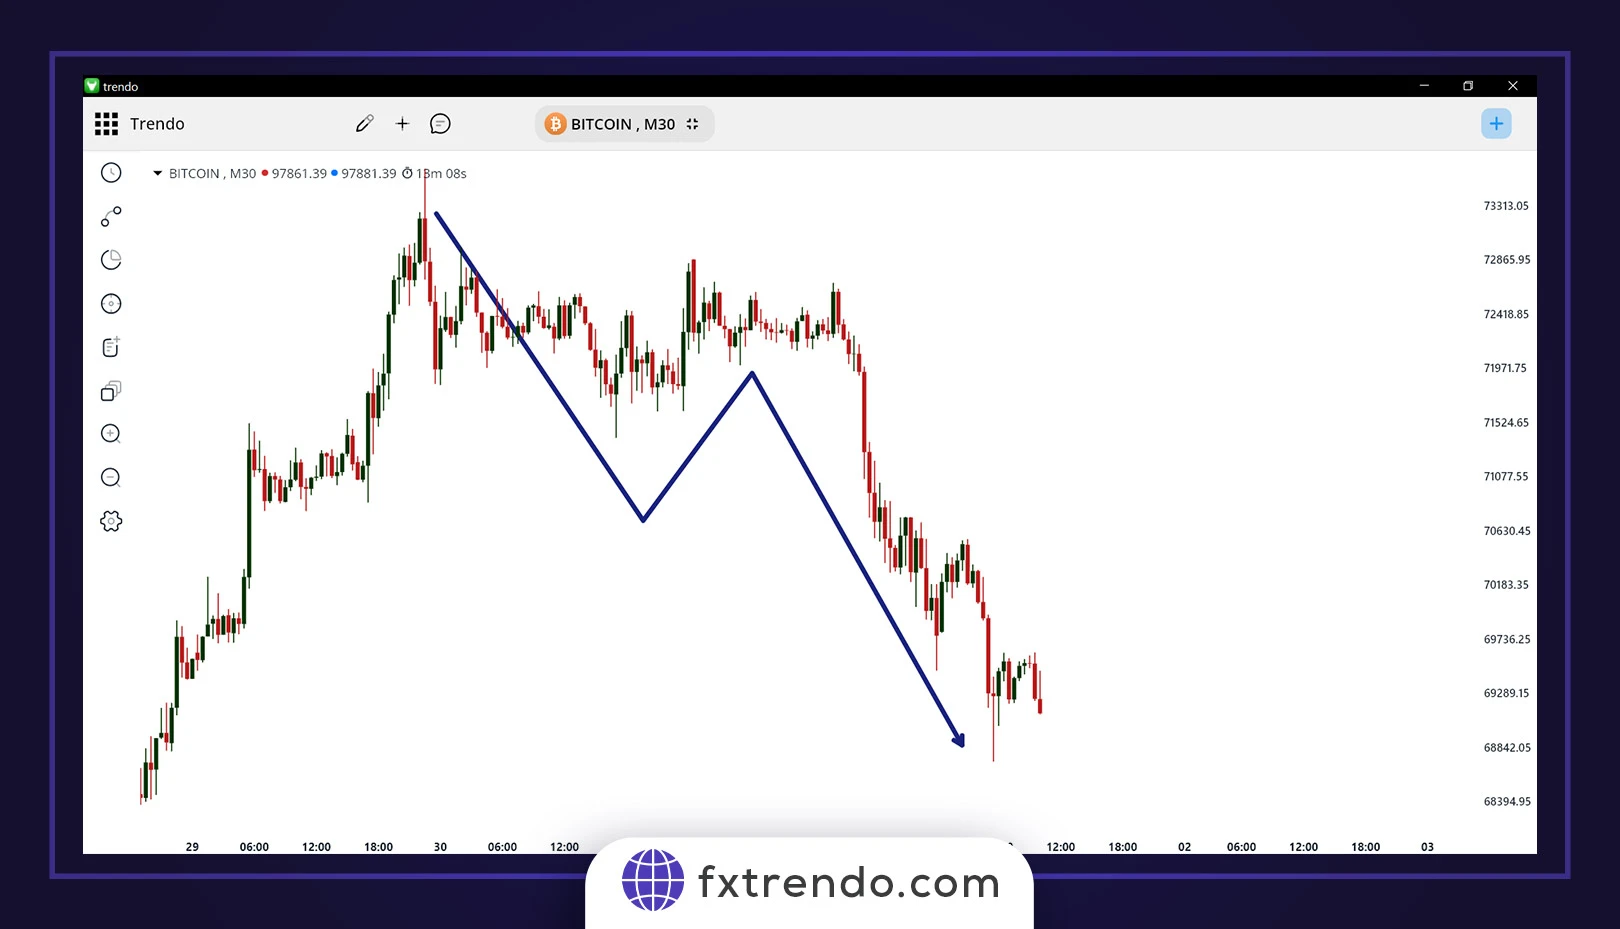
For example, as you can see in the image below, in the Bitcoin cryptocurrency on the 30-minute timeframe, the market has started a downtrend by creating a lower high and low:
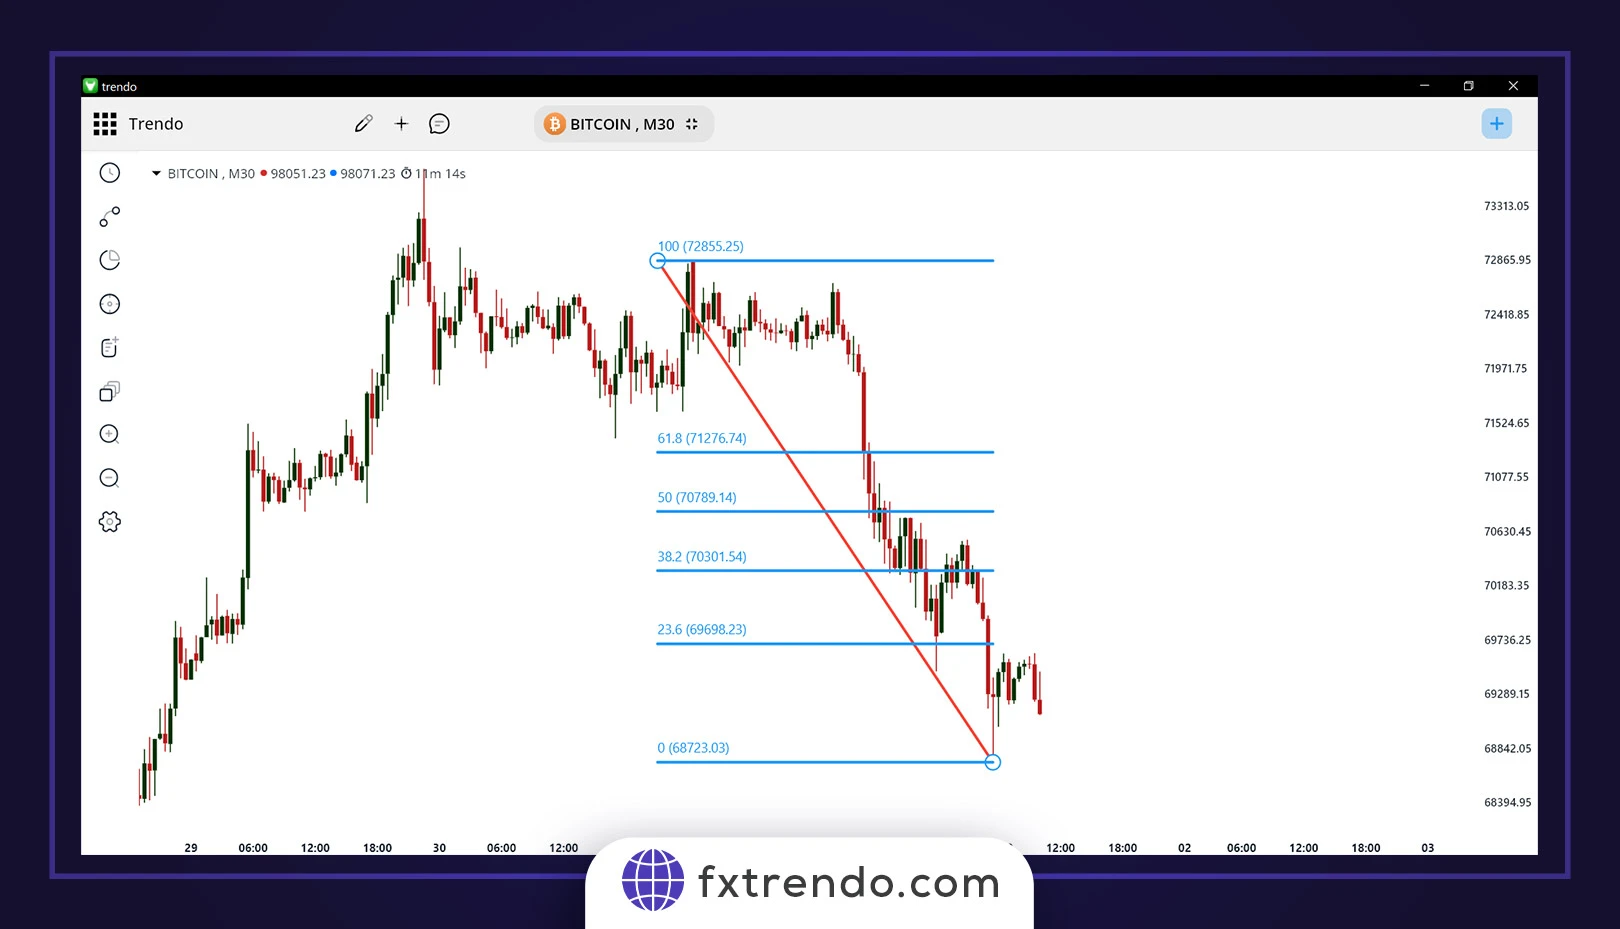
Step 2: Draw Fibonacci Levels on the Chart
Once the trend is identified, use the Fibonacci tool to draw retracement levels on your chart. These levels mark areas where the price might stop and resume its movement in the direction of the original trend.
The most important Fibonacci levels for this strategy are 50% and 61.8%, also known as the golden ratios. Typically, when the price reaches one of these levels and shows a reversal, it presents an optimal entry point in the direction of the trend.
In this example, in the downtrend that Bitcoin has started, we draw the Fibonacci retracement tool on the last downward move, from the top to the bottom, and wait for the price to correct to these levels.
Step 3: Enter the Trade After Confirmation
Once the price reaches one of the significant Fibonacci levels (preferably 50% or 61.8%), wait for additional confirmation before entering the trade. Many traders, driven by emotions, rush into trades without proper confirmation, which often results in losses. To minimize risk, use confirmation tools like candlestick patterns, technical indicators such as RSI or MACD, or other chart formations to verify the price’s intent to move in your favor.
In this example, the price stopped at the 61.8% level and you could have entered a sell trade in the direction of the trend when the confirmation candle closed and made a nice profit:
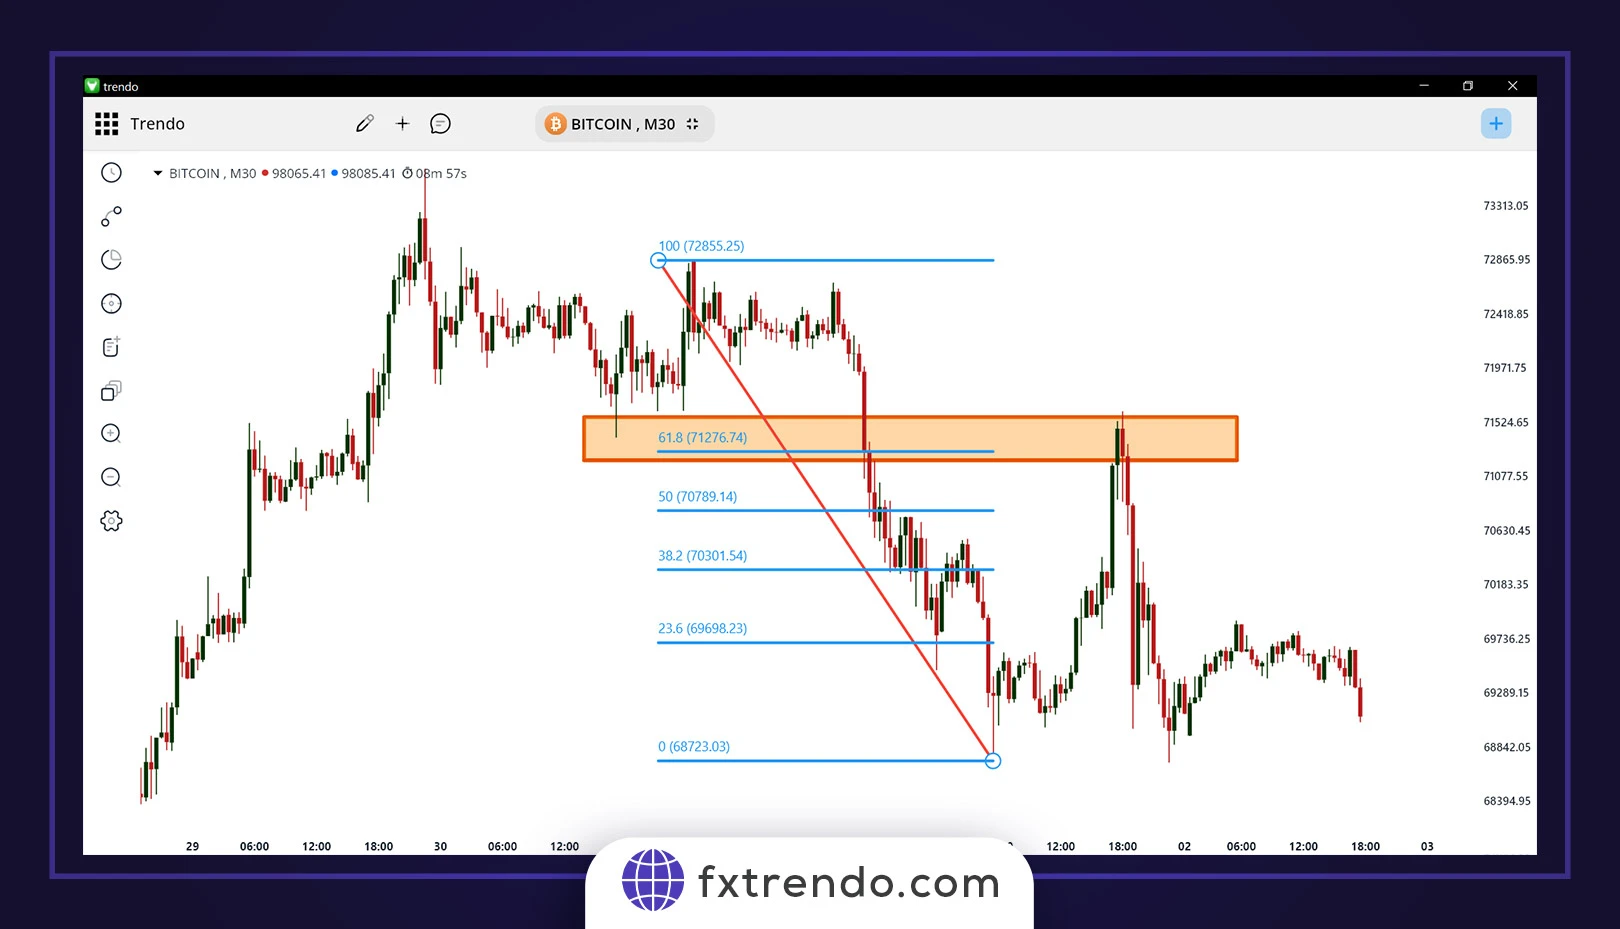
However, trading isn’t always this straightforward, and sometimes your stop loss might be triggered. Therefore, always prioritize risk management and never risk more than 2% of your capital on a single trade.
Step 4: Set Stop Loss and Take Profit Levels
After entering the trade, be sure to set both stop loss and take profit levels. Place your stop loss based on candlestick patterns or nearby swing highs/lows. For take profit, it’s essential to recognize that the market won’t always keep moving in your favor indefinitely. Set your take profit a bit beyond the last major swing high or low.
Ensure that your trade has a proper risk-to-reward ratio. The minimum recommended ratio is 1:2, meaning you’re aiming to gain at least twice as much as you risk. Maintaining this ratio will help ensure your long-term success in the market.
Read more:
What are Price retracement and Reversal Trends, and how to identify them?
Why Shouldn’t We Depend Completely on Fibonacci Levels?
While Fibonacci levels are widely used in technical analysis, they are not foolproof. Just like other support and resistance levels, Fibonacci retracements and extensions can be breached under certain market conditions. This means that relying solely on these levels for making trading decisions can be risky.
Fibonacci tools offer valuable insights, but they should not be the only factor guiding your trades. The market is unpredictable, and price movements often do not respect any single indicator, including Fibonacci. Therefore, it’s essential to incorporate other forms of analysis and risk management techniques when trading.
Forex trading is about managing probabilities, not certainties. A robust trading system should include multiple strategies for confirmation and risk control. This approach will help ensure that, over time, your trades remain profitable despite the inherent uncertainty of the market. Always remember to consider risk factors and never base decisions on a single tool or method.
Combining Fibonacci Levels with Other Technical Analysis Strategies
As mentioned earlier, to achieve a more comprehensive analysis and increase your chances of success in trading, it’s essential to have a broader perspective on price charts. Relying solely on Fibonacci levels may not always provide the most accurate signals. By combining Fibonacci tools with other technical analysis methods, you can confirm trade entries and exits more effectively.
Here are a few common methods for combining Fibonacci levels with other strategies:
1. Candlestick Patterns
Candlestick patterns, such as engulfing candles or pin bars, can help confirm the market’s direction after reaching a Fibonacci level. For example, if the price retraces to the 61.8% Fibonacci level and forms a bullish engulfing candle, this could signal a potential reversal in an uptrend.
2. Moving Averages
Moving averages are often used to determine the overall trend direction. When Fibonacci levels align with moving averages, such as the 50-period or 200-period moving average, the level’s significance is heightened. For instance, if the price retraces to a 50% Fibonacci level and also coincides with the 50-period moving average, it strengthens the case for a potential bounce.
3. RSI (Relative Strength Index)
RSI is a momentum oscillator that can show whether a market is overbought or oversold. When the price reaches a key Fibonacci level, checking the RSI for overbought or oversold conditions can provide additional confirmation. For example, if the price hits the 38.2% Fibonacci level and the RSI is below 30 (indicating an oversold market), this could signal a potential buying opportunity.
4. Support and Resistance Zones
Fibonacci levels often coincide with traditional support and resistance zones. When a Fibonacci level aligns with a previously identified support or resistance area, the price is more likely to react at that level. This alignment can improve the accuracy of your predictions.
By combining Fibonacci levels with these or other strategies, you can enhance your trading decisions. Remember that no single tool should be used in isolation. A multi-faceted approach helps ensure that you’re trading based on solid, confirmed signals rather than just relying on one source of information.
Trading Support and Resistance Zones with Fibonacci Levels
The concept of buying at support and selling at resistance is an attractive strategy for many traders, as it aligns with the natural market behavior of price reversal. However, trading in these zones without sufficient analysis can be risky.
There’s no guarantee that these levels will always hold, and price can sometimes break through support or resistance without warning. This is where Fibonacci levels come in, offering a useful tool for confirmation and enhancing the accuracy of your analysis.
When trading around support or resistance zones, Fibonacci retracements can help pinpoint more precise entry and exit points.
For example, if a market is approaching a known support zone, drawing Fibonacci retracement levels on a previous price move can highlight key levels where the price might reverse, such as the 38.2%, 50%, or 61.8% levels.
These levels can serve as additional confirmation that the market might respect the support or resistance zone, increasing the probability of a successful trade.
Similarly, when the price reaches a resistance zone, Fibonacci extensions can help identify potential price targets and profit-taking levels. This ensures you’re not only entering the market at a favorable price but also exiting at an optimal point, increasing your overall trading efficiency.
By combining Fibonacci levels with traditional support and resistance analysis, you create a more robust trading strategy. Fibonacci serves as a valuable confirmation tool, adding precision to your decision-making process and reducing the risk of false breakouts.
Trading with Trendlines and Candlestick Patterns Along with Fibonacci Levels
Trendlines and candlestick patterns are core components of technical analysis. Trendlines help identify the direction of price movement, while candlestick patterns offer insights into market sentiment. On their own, these tools may not always provide reliable signals. However, when combined with Fibonacci levels, they offer stronger signals that can significantly increase the likelihood of a successful trade.
For instance, when a trendline aligns with a key Fibonacci retracement level, it suggests that the price may experience a reversal at this point. This combination of a trendline and Fibonacci level provides additional confidence in the trade.
Similarly, candlestick patterns, such as engulfing patterns or pin bars, near a Fibonacci level can act as confirmation for entry or exit points. These patterns can indicate potential market reversals or continuations, and when seen near Fibonacci levels, they strengthen the probability of the anticipated price move.
For more information, you can refer to the article “Trading strategy with trend line and candlestick patterns with Fibonacci levels confirmation“.
Setting Stop Loss and Take Profit Levels with Fibonacci Tools
One of the biggest challenges traders face is determining the right levels for stop loss and take profit. Using Fibonacci tools can make this process more precise and reliable. By aligning Fibonacci levels with your trade setup, you can identify optimal points to manage risk and potential profits.
To set a stop loss, traders often use Fibonacci retracement levels. A common approach is to place the stop loss just below a key retracement level (like 61.8% or 78.6%) in an uptrend, or just above these levels in a downtrend. This strategy helps protect the trade in case the price moves against the expected direction, while giving it enough room to breathe for a possible price correction.
For take profit, Fibonacci extension levels can be useful. These levels, particularly 1.618 and 2.618, can act as targets for price moves. Once the price reaches one of these extension levels, it may experience resistance or reversal. Setting take profit orders near these levels can help lock in profits before the market potentially changes direction.
By using Fibonacci tools to set stop loss and take profit levels, traders can create more structured and disciplined trade plans, leading to better risk management and increased trading confidence.
Common Mistakes to Avoid When Using Fibonacci in Forex
Fibonacci tools can be effective in Forex trading, but they are not foolproof. Many traders, especially beginners, make mistakes when using Fibonacci retracements and extensions. Avoiding these errors can improve your trading accuracy.
1. Relying Only on Fibonacci Levels:
Relying solely on Fibonacci levels without considering other factors, such as market trends, support and resistance, or other indicators, can lead to mistakes. Fibonacci levels should support your analysis, not be the only basis for trading decisions. Combine them with other methods for a clearer market view.
2. Ignoring Market Context: Applying Fibonacci without considering the broader market context can result in misleading signals. Always ensure that your Fibonacci levels align with the overall market trend for more reliable predictions.
3. Incorrect Placement of Fibonacci Levels: Misplacing Fibonacci retracement levels is a common mistake. To use them correctly, ensure you identify the right swing high and swing low points. Incorrect placement can lead to faulty analysis and poor trades.
4. Overtrading Based on Fibonacci Signals: Avoid overtrading based on every Fibonacci level. Not all Fibonacci levels will lead to successful trades. Wait for confirmation signals, such as candlestick patterns or other indicators, to increase the reliability of your trades.
5. Ignoring Risk Management: Failing to set proper stop-loss orders or taking unnecessary risks around Fibonacci levels can result in losses. Always use risk management strategies and avoid risking too much of your capital on one trade.
6. Not Adjusting Fibonacci Levels as the Market Changes: The market is dynamic, and your Fibonacci levels should be adjusted accordingly. Failing to update levels as the market evolves can result in missed opportunities or inaccurate predictions.
By avoiding these mistakes, you can use Fibonacci tools more effectively in Forex trading and improve your decision-making process.
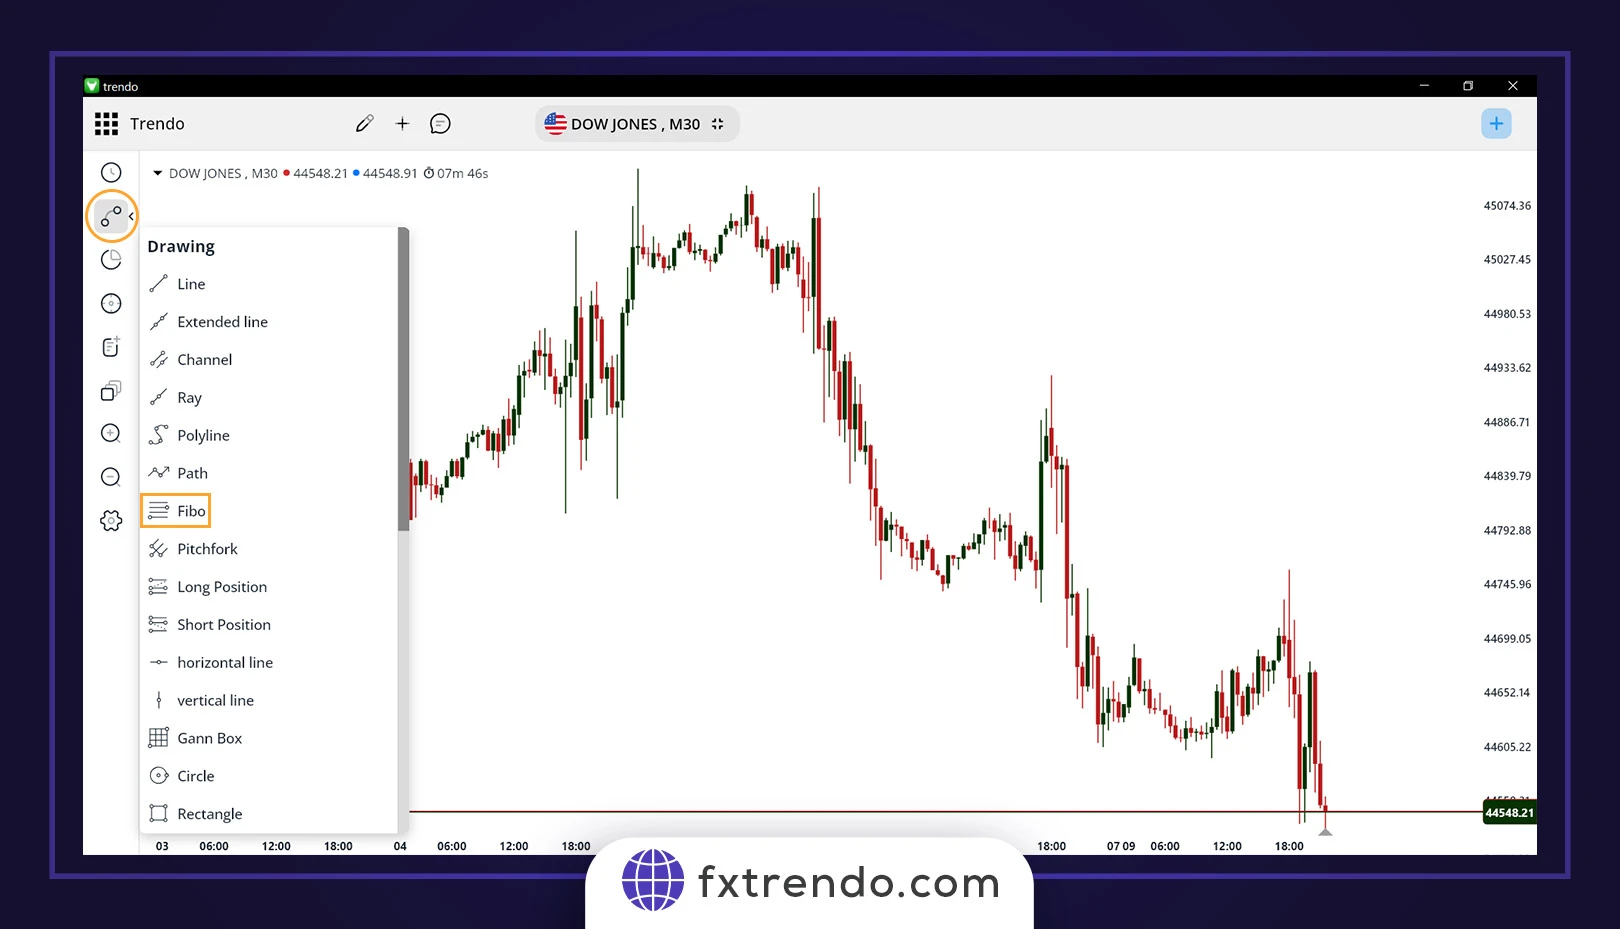
Using the Fibonacci Tool on the Trendo Broker Trading Platform
To use the Fibonacci tool on the Trendo broker platform:
Access the Drawing Tools: Go to the “Drawing” section on the platform, where you’ll find various tools for technical analysis, including Fibonacci tools.
Select the Fibonacci Tool: Choose either the Fibonacci retracement or extension tool based on your analysis needs.
Apply the Fibonacci Tool : On the chart, click to start drawing the Fibonacci levels. For retracements, select a significant swing high and swing low. For extensions, select the previous trend to estimate price targets.
Adjust the Levels: After applying the tool, adjust the Fibonacci levels to display key percentages like 23.6%, 38.2%, 50%, 61.8%, and 78.6%.
Analyze the Market: Observe how the price interacts with these levels. If the price bounces or reverses at these levels, it may signal potential trading opportunities.
The Fibonacci tool on the Trendo platform helps identify key market levels and aids in making informed trading decisions.
Conclusion
Fibonacci levels are a powerful tool in forex trading, offering significant insights into market behavior. Every technical trader should learn how to use these levels and develop a deep understanding of their applications. Mastering Fibonacci tools enhances your ability to analyze the market effectively and adds valuable depth to your trading strategy.
Fibonacci levels are not limited to the uses we’ve discussed. For instance, they are also crucial for improving the accuracy of identifying and confirming harmonic patterns, a method used by traders to predict price movements based on specific geometric patterns.
By integrating Fibonacci into your trading approach, you can make more informed decisions, increase your chances of success, and improve overall risk management.