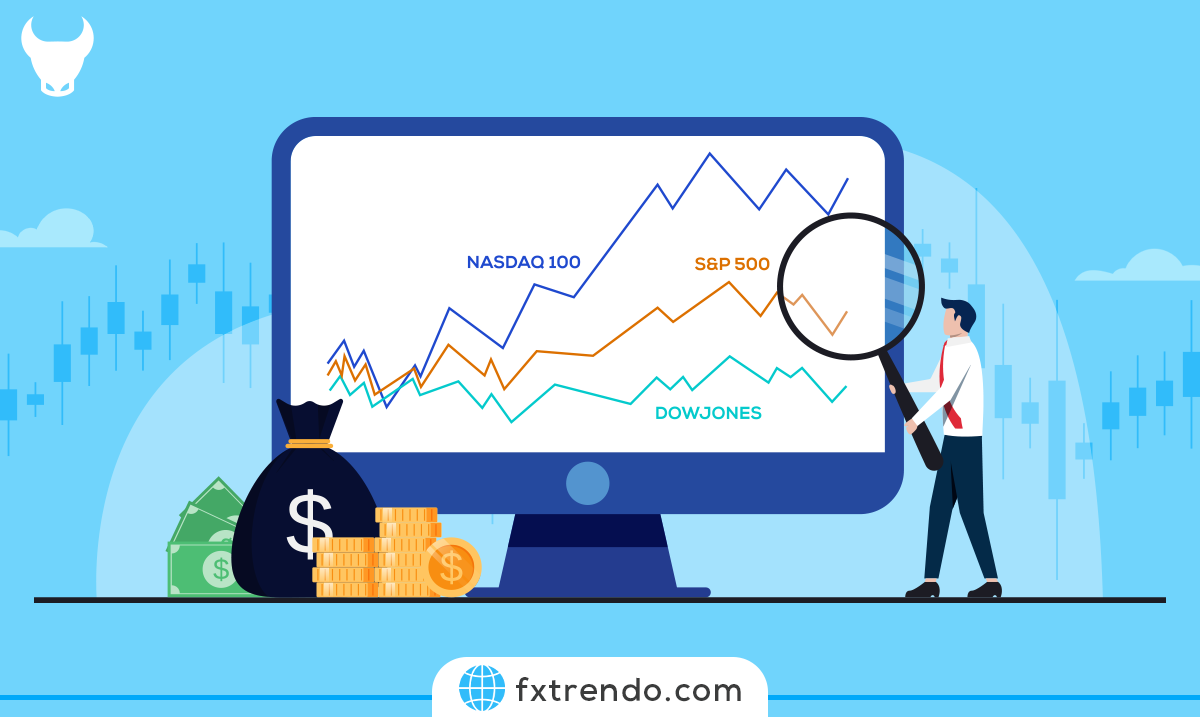
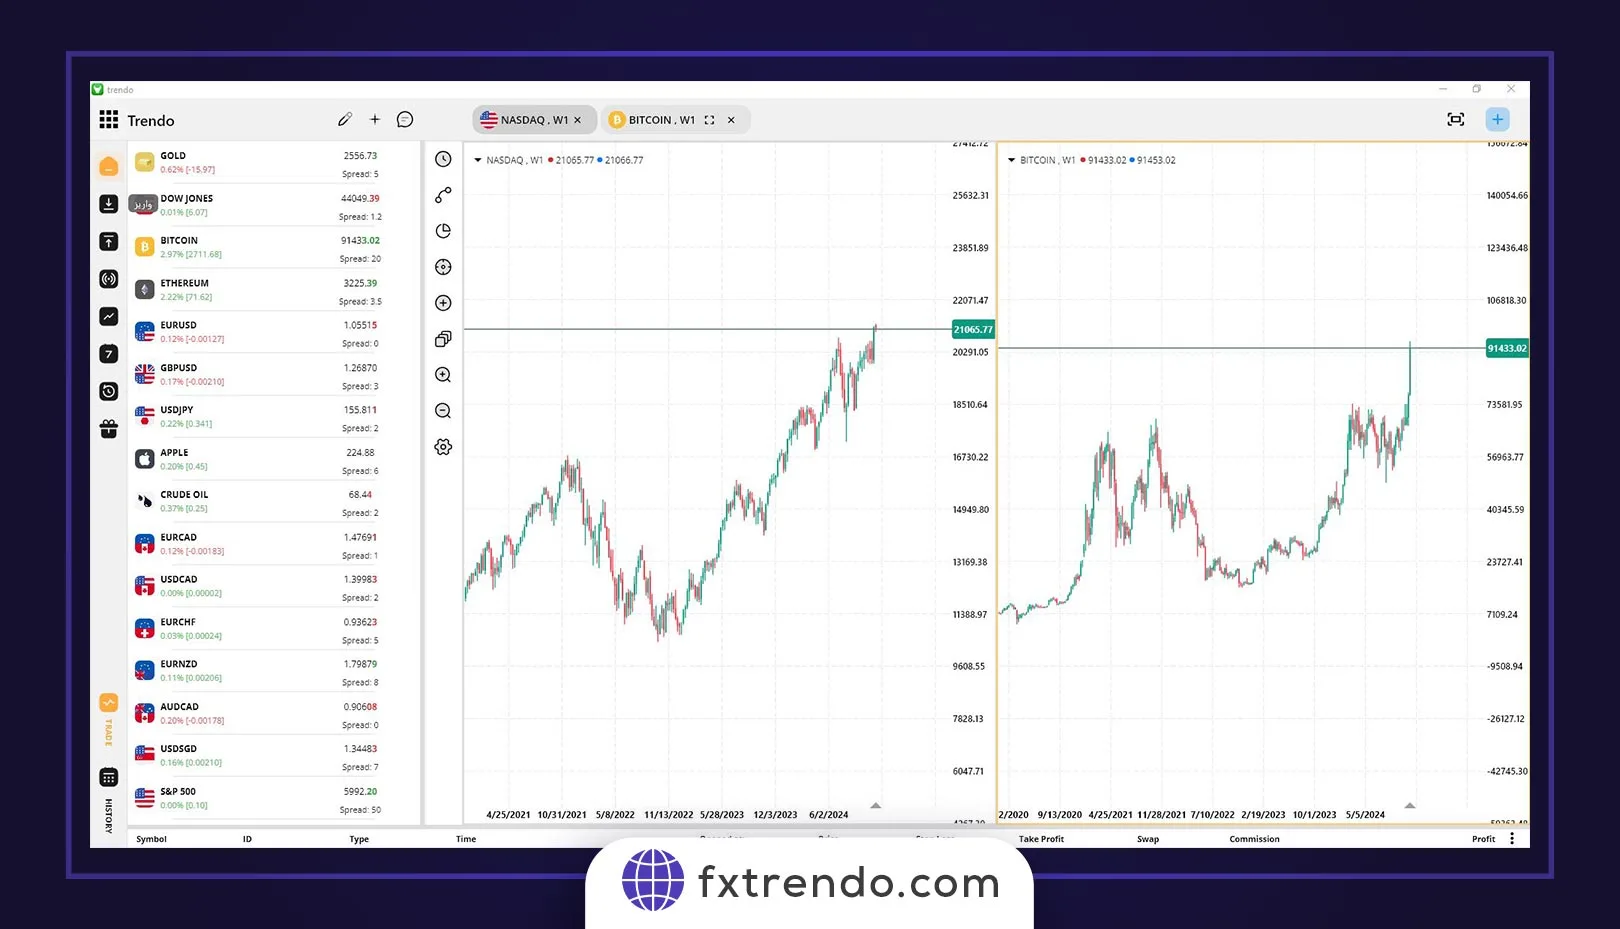
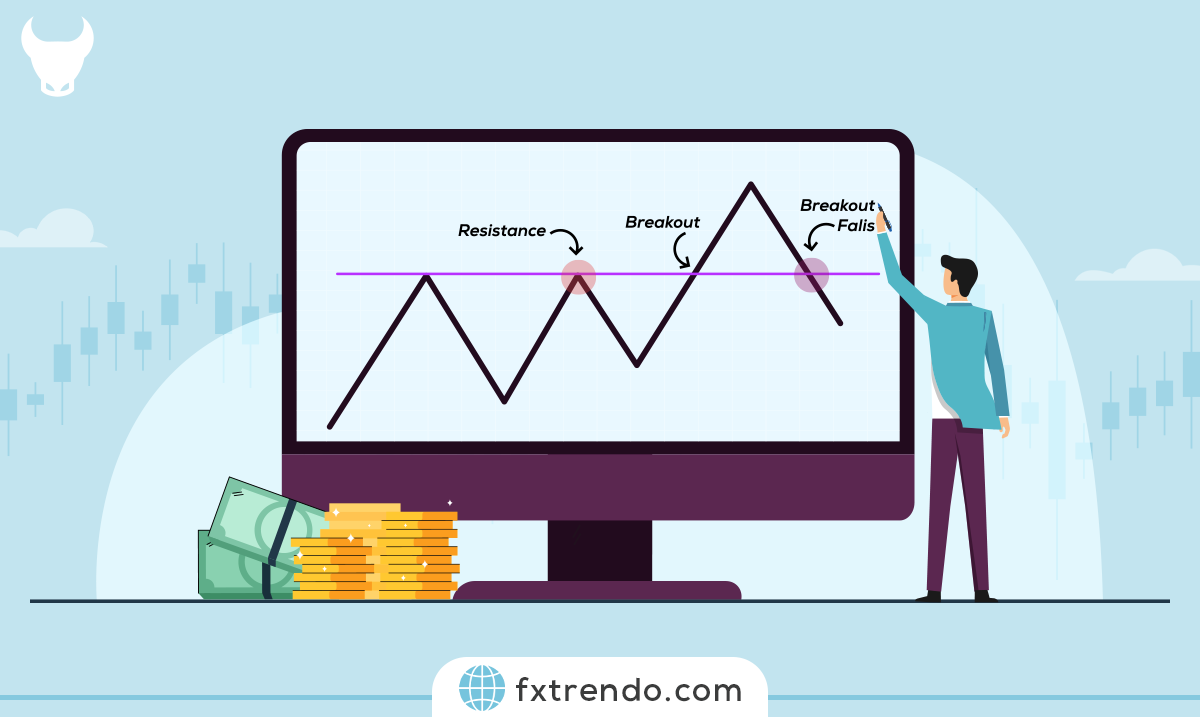
Understanding the correlation between stock indices helps investors comprehend market dynamics, diversify portfolios, and predict market shifts. This knowledge is essential for strategic decisions, risk management, and seizing investment opportunities.
Eager to explore? Let’s dive deeper into the world of NASDAQ and its correlations with other indices.
What is NASDAQ?
NASDAQ, short for the National Association of Securities Dealers Automated Quotations, is a global electronic marketplace for buying and selling securities. It was established in 1971 as the world’s first electronic stock exchange. Unlike traditional stock exchanges with physical trading floors, NASDAQ operates entirely through a computerized network, enabling faster and more efficient trades.
NASDAQ is known for listing technology and internet-based companies, including major players like Apple, Microsoft, and Amazon. This focus on tech firms has made NASDAQ a key indicator of the technology sector’s health and progress.
The NASDAQ Composite Index, which includes over 3,000 stocks listed on the NASDAQ exchange, is weighted by market capitalization. Larger companies have a greater impact on the index’s movements, providing a comprehensive view of the performance of tech and growth-oriented companies.
Tracking NASDAQ’s movements and trends provides insights into technological innovation and economic growth.
What is Correlation in Financial Markets?
In financial markets, correlation refers to the statistical relationship between the movements of two or more assets. When assets are correlated, their prices tend to move in a similar direction.
There are two main types of correlation: positive and negative. Positive correlation means that when the price of one asset goes up, the price of the other asset also tends to rise. Negative correlation means that when the price of one asset goes up, the price of the other asset usually falls.
By analyzing how different assets move in relation to each other, investors can spread their investments across assets that do not move together, reducing the overall risk. For example, if stocks and bonds are negatively correlated, holding both in a portfolio can provide balance during market volatility.
Correlation is measured using a coefficient that ranges from -1 to +1. A coefficient of +1 indicates a perfect positive correlation, where assets move exactly in tandem. A coefficient of -1 indicates a perfect negative correlation, where assets move in opposite directions. A coefficient of 0 means there is no correlation between the assets’ movements.
Analyzing the Correlation between NASDAQ and Other Global Indices
Understanding the correlation between NASDAQ and other major market indices can simplify decision-making for traders. For example, discovering a positive correlation between NASDAQ and the SPX500 can prevent simultaneous trading in both indices, as they often move in the same direction. This approach allows traders to focus on a single position, making it easier to manage.
NASDAQ and SPX500 Correlation
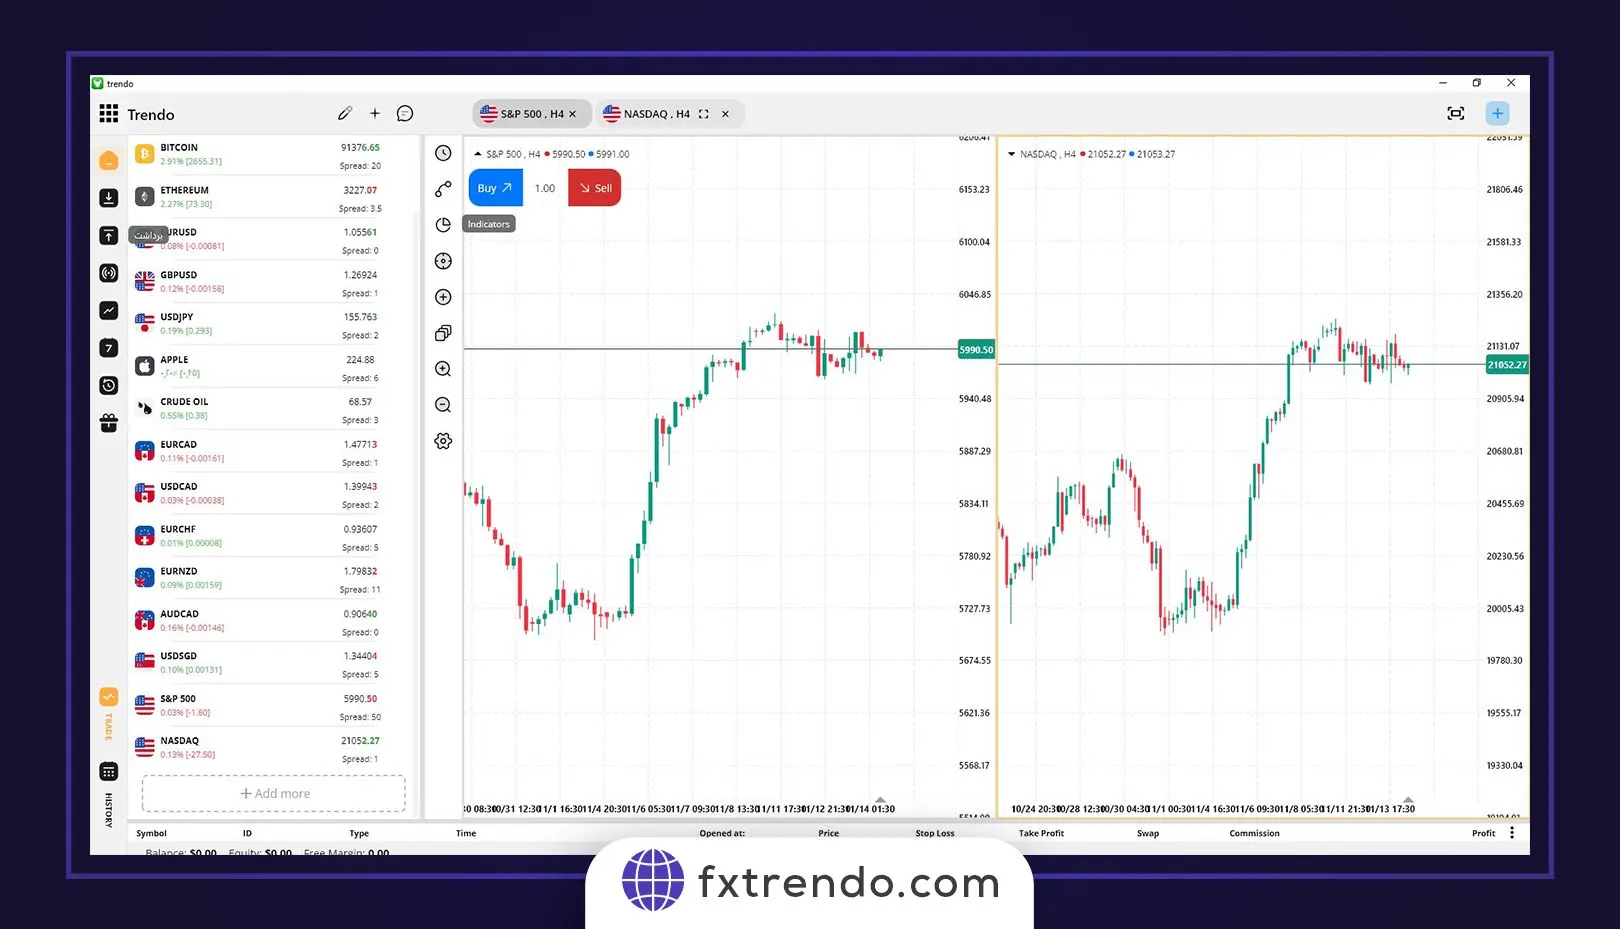
The SPX500 index, comprising 500 large publicly traded companies in the U.S., has a close connection with NASDAQ. Although they represent different market segments, there is significant overlap, especially in the technology sector. This often results in a positive correlation, meaning they tend to move together. However, this correlation isn’t constant and can change due to shifts in company weightings within the indices.
The graph below reveals a clear correlation between these two indicators.
NASDAQ and Dow Jones Correlation
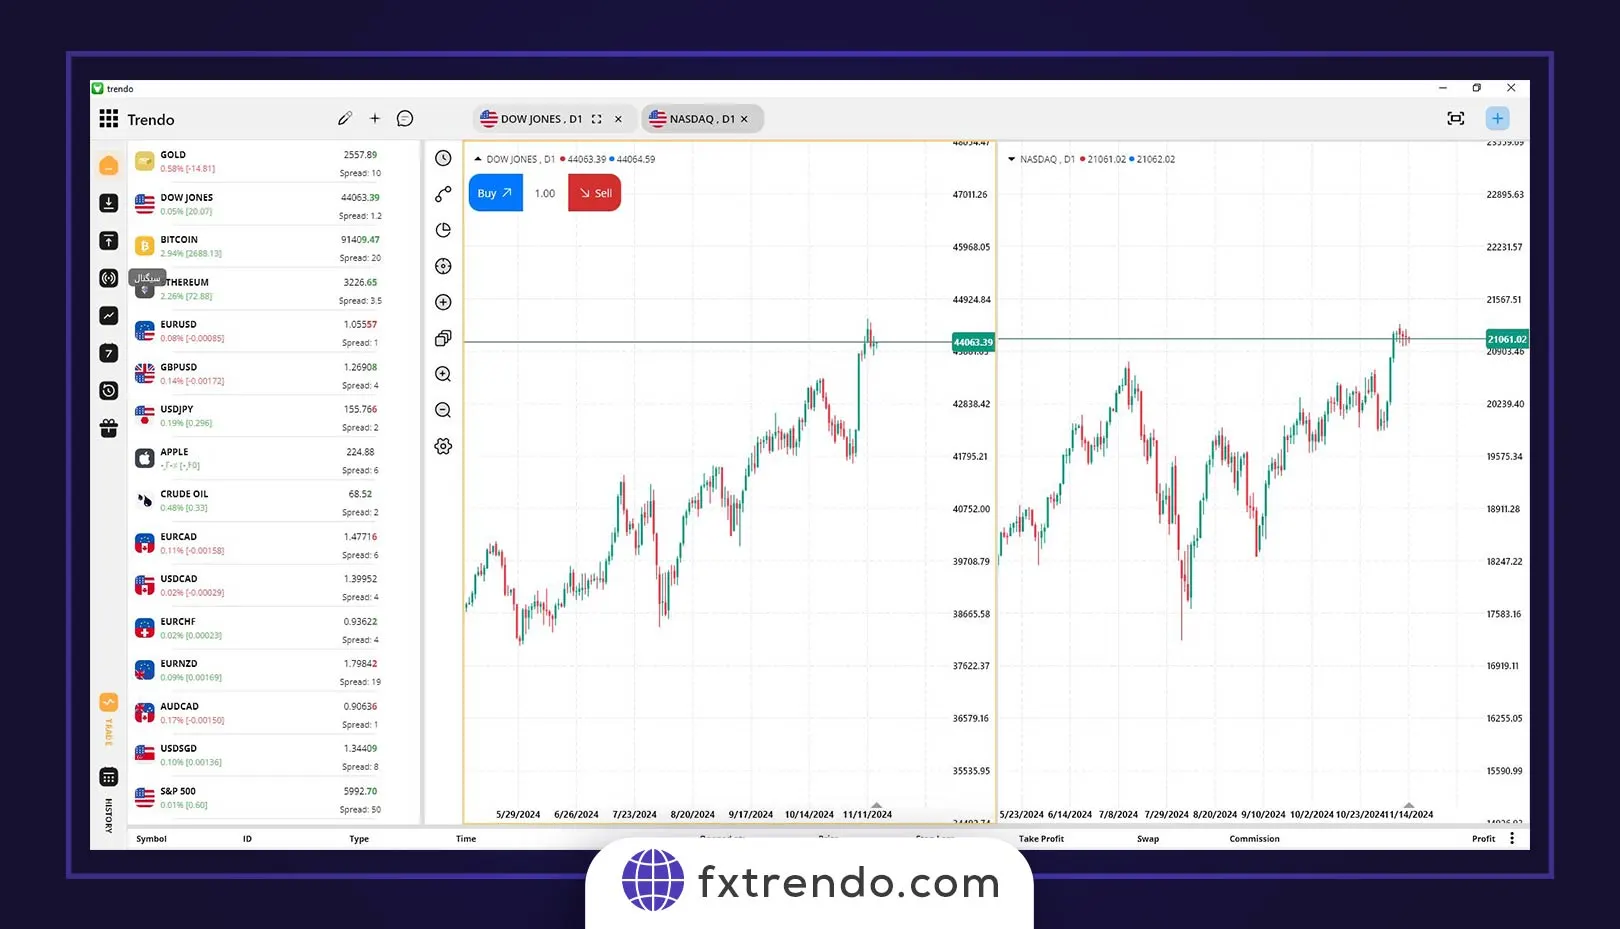
The Dow Jones Industrial Average (DJIA) consists of only 30 major stocks. As a price-weighted index, it doesn’t consider market capitalization, leading to different movements between DJIA and NASDAQ. This results in varying positive and negative correlations. Investors should pay attention to economic trends that impact these indices.
As you can see, these two indicators sometimes have correlated movements and sometimes ignore each other.
NASDAQ and International Indices Correlation
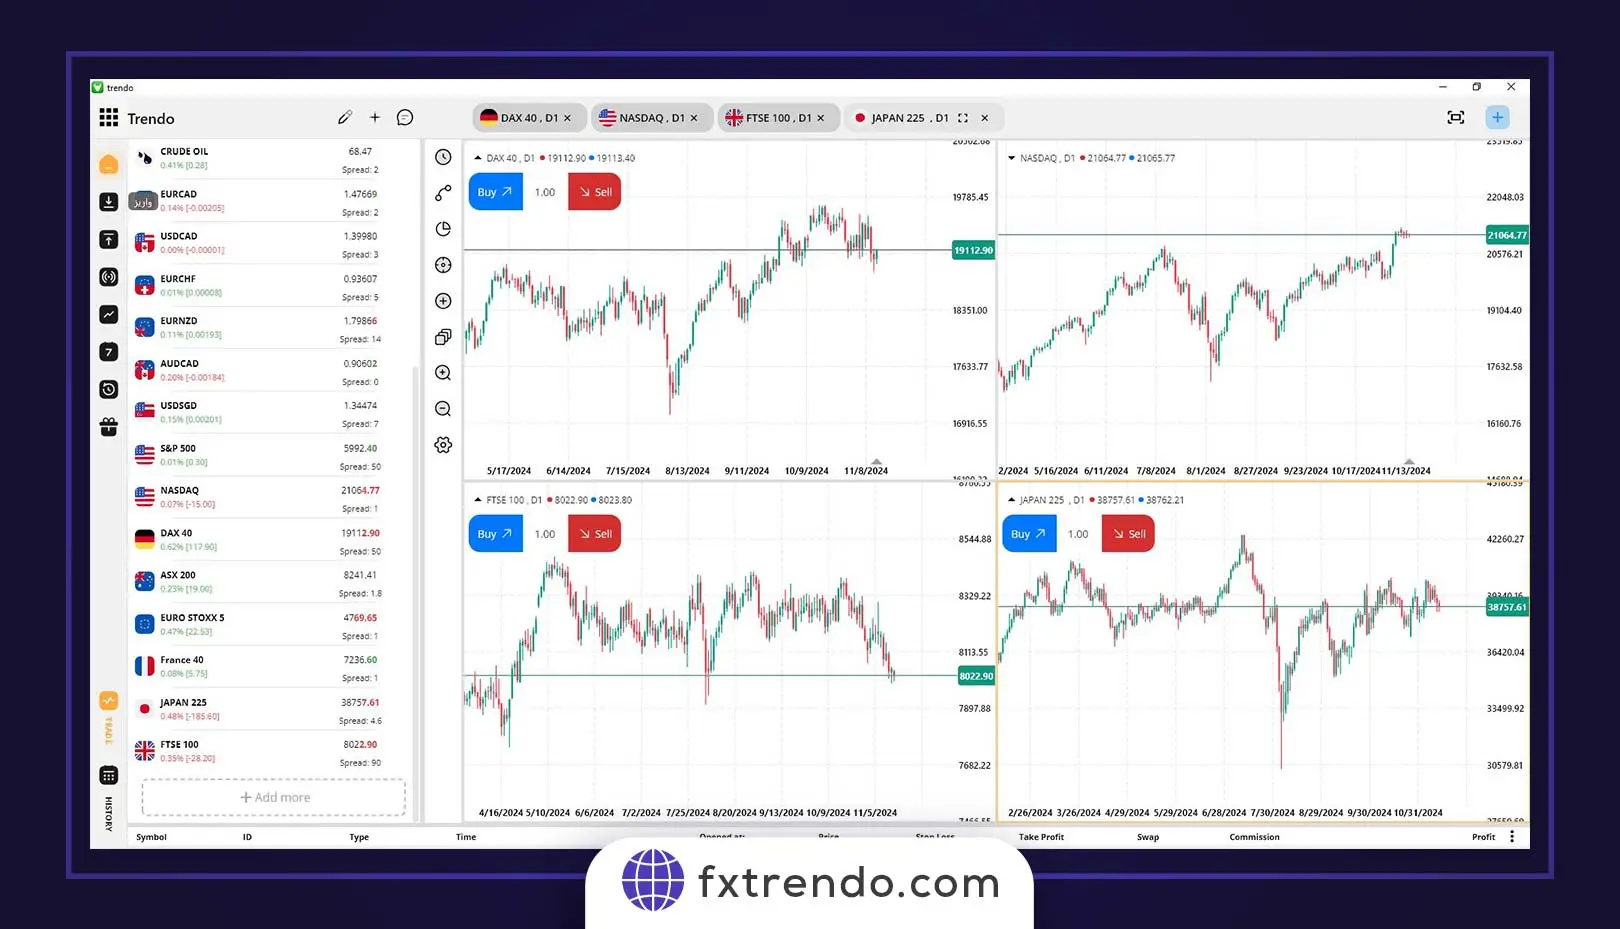
Outside U.S. markets, NASDAQ’s correlation with international indices is also significant. The FTSE in the UK, the Nikkei in Japan, and the DAX in Germany represent major global markets. Understanding these correlations can be valuable for portfolio diversification and global risk management. The correlation between these indices and NASDAQ can be positive or negative, depending on varying national policies.
The correlation between these indices and Nasdaq varies across different periods, influenced by varying national policies. It can be either positive or negative.
Read more:
How Does NASDAQ Affect the Stock Market?
NASDAQ and Commodities Correlation
Commodities and NASDAQ can also exhibit correlations. This relationship shows how commodity prices and NASDAQ index movements align. For example, rising oil prices might increase the value of tech companies, impacting NASDAQ. Economic conditions, supply and demand changes, policy decisions, and geopolitical factors can all influence this correlation.
NASDAQ and Cryptocurrency Correlation
The correlation between the cryptocurrency market and NASDAQ highlights the interaction between these two markets. They share a deep connection, possibly due to similar risk appetites and economic and political influences. Given their focus on tech companies, these markets often show positive correlation over different periods. Studying these correlations can benefit investors and analysts, though they may change over time.
Factors Influencing Correlation between NASDAQ and Other Indices
Several factors can influence the correlation between NASDAQ and other major indices. Understanding these factors helps investors and analysts interpret market movements and make informed decisions.
1. Economic Conditions
General economic conditions, such as GDP growth, unemployment rates, and inflation, play a significant role. Strong economic performance can lead to positive correlations as markets tend to rise together. Conversely, during economic downturns, correlations might increase as markets move downwards in unison.
2. Sector Performance
The performance of specific sectors, particularly technology, has a major impact. Since NASDAQ is heavily weighted towards tech stocks, any significant movement in this sector can influence its correlation with other indices that also have substantial tech components.
3. Monetary Policies
Central bank policies, including interest rate changes and quantitative easing, can affect market correlations. For example, a low-interest-rate environment might boost stock markets globally, increasing their correlation.
4. Geopolitical Events
Political stability, international trade agreements, and geopolitical tensions can impact correlations. Events such as trade wars, elections, or geopolitical conflicts can lead to synchronized movements across global markets.
5. Market Sentiment
Investor sentiment and market psychology also play a role. Bullish sentiment can drive markets up together, while bearish sentiment can lead to simultaneous declines. Market sentiment is often influenced by news, earnings reports, and other market-moving events.
6. Currency Fluctuations
Exchange rate movements can impact correlations, especially for indices in different countries. For instance, a strong U.S. dollar might affect international markets differently compared to domestic markets, influencing their correlation with NASDAQ.
7. Technological Innovations
Technological advancements and disruptions can also influence correlations. Significant tech innovations can drive NASDAQ and other tech-heavy indices together, while a slowdown in tech development might have the opposite effect.
By understanding these factors, investors can better navigate market complexities and anticipate potential shifts in correlation between NASDAQ and other indices, aiding in strategic decision-making and risk management.
How Investors Can Use Index Correlations for Portfolio Strategy?
Understanding index correlations can be a powerful tool for investors when developing their portfolio strategies. Here’s how:
1. Diversification
By analyzing correlations, investors can choose assets that do not move in tandem. For instance, if NASDAQ and an international index like the Nikkei have low or negative correlation, combining them in a portfolio can reduce risk. Diversification aims to spread investments across various assets to minimize the impact of any single asset’s poor performance.
2. Risk Management
Correlation analysis helps investors manage risk by balancing their portfolios. If two indices are highly correlated, the risk of loss is higher if both decline simultaneously. By including assets with low or negative correlations, investors can buffer their portfolios against market volatility, ensuring more stable returns.
3. Strategic Allocation
Investors can use correlation data to make informed decisions about asset allocation. For example, if technology stocks in NASDAQ have a strong positive correlation with another sector, investors might adjust their investments to avoid overexposure. This strategic allocation helps in achieving a balanced and resilient portfolio.
4. Hedging
Understanding correlations allows investors to hedge their portfolios effectively. By investing in assets that move inversely to each other, investors can protect against losses in one area by gains in another. For instance, if tech stocks fall, but commodities rise, the gains from commodities can offset the losses from tech stocks.
5. Identifying Opportunities
Correlation analysis can uncover opportunities for arbitrage and tactical investing. For example, if an investor notices a temporary divergence between two normally correlated indices, they might exploit this gap for potential gains. Monitoring correlations can highlight such anomalies and prompt timely investment actions.
6. Performance Monitoring
Keeping an eye on correlations helps investors monitor the performance of their portfolios. Changes in correlation patterns can signal shifts in market dynamics, prompting a review and adjustment of investment strategies. Regularly assessing correlations ensures that the portfolio remains aligned with the investor’s risk tolerance and financial goals.
This approach leads to a more resilient and balanced investment portfolio, capable of weathering various market conditions.
Conclusion
Analyzing the correlation between the NASDAQ and other global indices is a crucial tool for investors aiming to diversify their portfolios.
Positive correlations indicate synchronized movements, but it is important to remember that correlations can change over time based on economic conditions.
By understanding these correlations, investors can make more informed decisions in the dynamic landscape of global markets, ultimately improving their profitability.
