


What is MACD?
MACD (Moving Average Convergence Divergence) is a technical oscillator that measures the difference between two (EMA) exponential moving averages of different periods and consists of the following components:
- MACD line
- Signal line
- Histogram
Further, we briefly explain each component.
MACD line:
The MACD line is the difference between the two EMAs of a currency pair. The most commonly used EMAs are 12 and 26-day EMAs. This line is drawn in a separate chart below the price chart.
Signal line:
The signal line is a 9-day EMA from the MACD line. It is used to generate trading signals and drawn on the same chart.
Histogram:
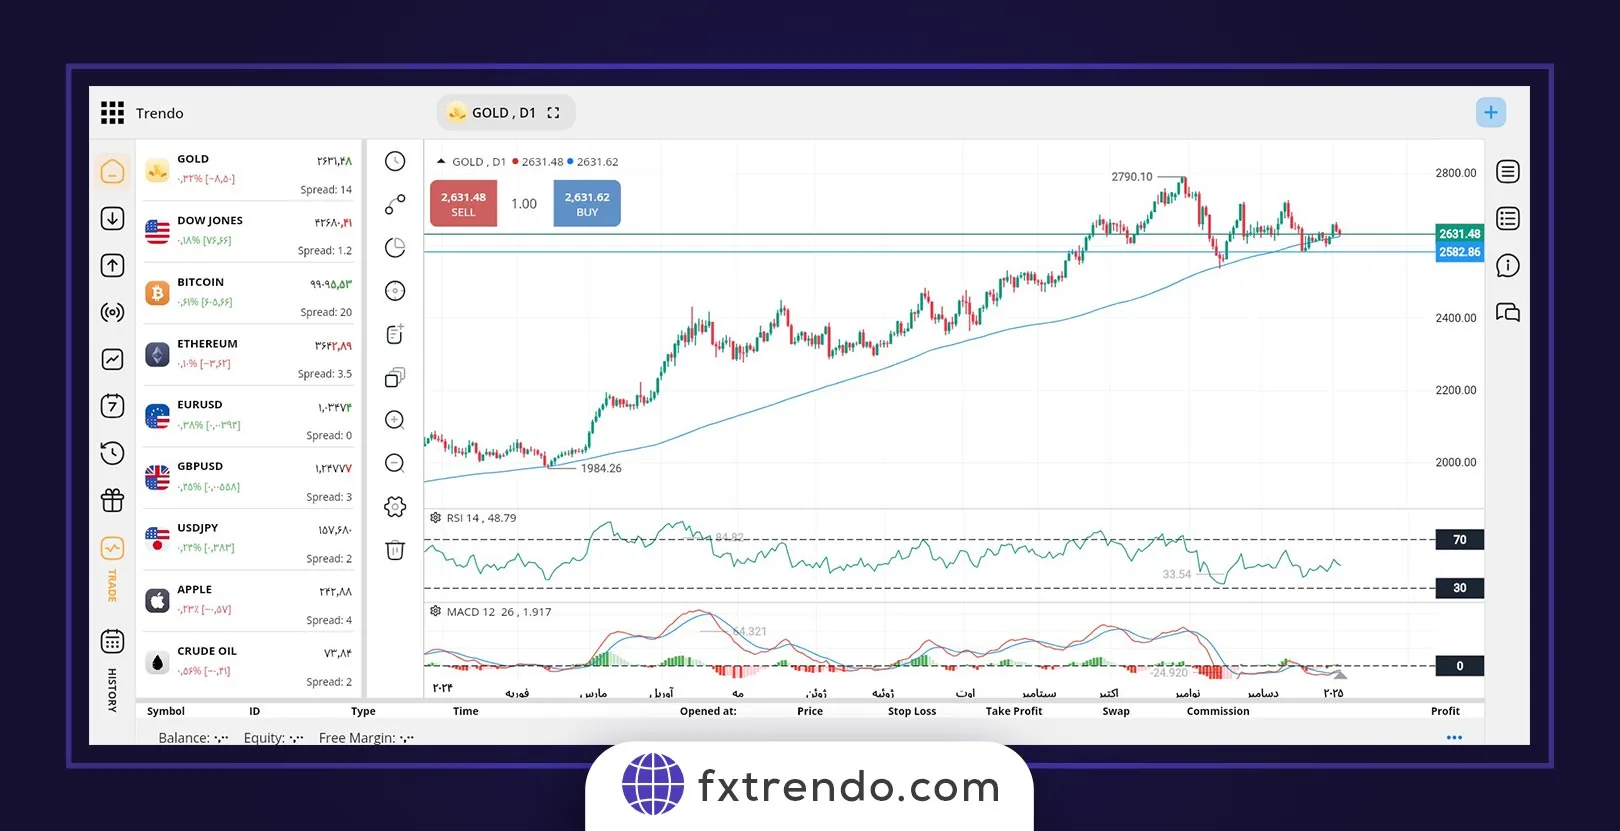
The histogram is the difference between the MACD line and the signal line used to visually show the trend’s strength. When the histogram is above the zero line, it indicates an uptrend, and if it’s below the zero line, it implies a downtrend.
How to calculate MACD?
We can calculate the MACD indicator in several steps:
Step 1: Calculate the 12 EMA.
The first step in calculating the MACD is to figure the 12-day EMA. To do that, you must add the currency pairs’ closing prices in the last 12 candles and divide the result by 12.
Step 2: Calculate the 26 EMA
The second step is to calculate the 26-day EMA. It is the same way as above, but using the closing prices of the last 26 candles.
Step 3: Calculate the MACD line
Once you have calculated the 12 and 26-day EMAs, you can calculate the MACD line by subtracting the 26 EMA from the 12 EMA.
Step 4: Calculate the signal line
The next step is calculating the signal line, which is the MACD line’s 9-day EMA. To do this, you need to calculate the MACD line’s EMA using the data of the last 9 candles, as in the above method.
Step 5: Calculate the histogram
Finally, you can calculate the histogram by subtracting the signal line from the MACD line. A histogram is drawn as a bar chart, where positive bars indicate upward movement and negative bars imply downward movement.
Advantages and disadvantages of using MACD
The MACD indicator advantages are:
- We can use it as a trend and momentum indicator.
- Provides clear buy and sell signals using line intersections and divergences.
- We can use this indicator with other technical analysis methods for higher success.
The MACD indicator disadvantages are:
- This indicator can provide a false reversal trend. Sometimes correctional signals shown by the MACD divergence do not mean that a significant reversal trend is happening but can mean that a stop or ranging move is underway before the trend continues. Therefore, MACD cannot predict all reversal trends.
- It often does not provide a detailed analysis of a trend. Trend continuation signals may be infringed or make a minor move before the trend changes.
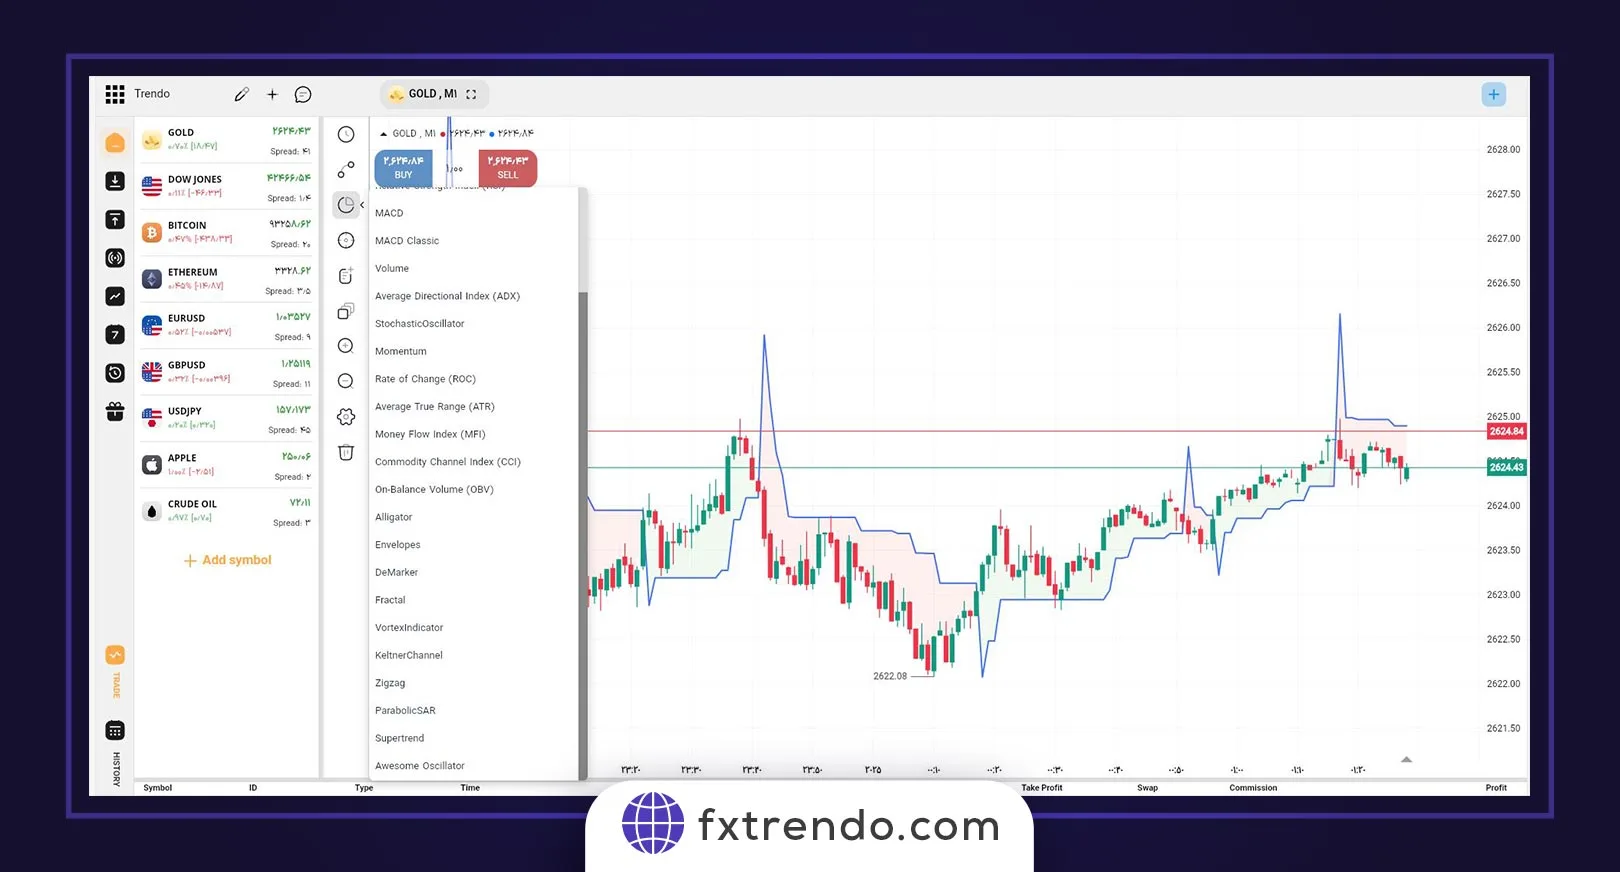
Trading with the MACD indicator
There are different ways to trade with the MACD indicator in forex trading. The most common methods are:
- MACD line crossover
- Divergence
- Overbought or oversold conditions
- Trend following conditions
Stay tuned till the end for a complete tutorial on these strategies with examples.
MACD line crossover:
One of the easiest ways to trade with the MACD indicator using crossing lines. A bullish crossover occurs when the MACD line crosses the upward signal line, indicating a possible buy signal. Conversely, a bearish crossover occurs when the MACD line crosses the downward signal line, indicating a potential sell signal. Traders can use MACD line crossover with other technical indicators and price action analysis to confirm potential buy and sell signals. For example, a trader might wait for a bullish MACD crossover to happen and then confirm the signal with a bullish candlestick pattern or a support level.
Read More:
Trading Strategy Based on Price Action in Forex
Divergence:
MACD divergence occurs when the MACD indicator movements are opposite to the asset’s price performance. As stated in the RSI practical tutorial article, there are 4 types of divergence, which are:
- Positive regular divergence
- Negative regular divergence
- positive hidden divergence
- Negative hidden divergence
Further, you can read each type’s explanation with examples.
Positive Regular Divergence:
Positive Regular Divergence occurs when the asset price makes a lower floor at the end of a downtrend, but the MACD makes a higher floor. This divergence indicates that the downtrend’s strength is waning, and a potential price reversal or retracement may occur.
Negative Regular Divergence:
A Negative Regular Divergence occurs when an asset price makes a higher ceiling in an uptrend, but the MACD makes a lower ceiling. This move indicates that the uptrend’s strength is waning, and a potential price retracement or reversal may occur.
Positive Hidden Divergence:
A positive hidden divergence occurs when the asset price makes a higher floor in an uptrend, but the MACD fails to make a higher floor. This contrast shows that we will probably see the uptrend’s continuation.
Negative Hidden Divergence:
A negative hidden divergence occurs when an asset’s price makes a lower ceiling in a downtrend, but the MACD cannot make a lower ceiling. This contrast shows that we will probably see the downtrend’s continuation.
Overbought or oversold conditions:
We can also use MACD to identify overbought and oversold conditions in the market. When the MACD line deviates too far from the signal line, it may indicate that the asset is overbought or oversold, and a reversal or price retracement may occur. Traders can use overbought and oversold conditions with other technical indicators and price action analysis to confirm possible trend reversals. For example, a trader might wait for the MACD line to reach an overbought zone and then confirm the signal with a bearish candlestick pattern or a resistance level.
Trend-following conditions:
Another method is to use MACD as a trend-following indicator. When the MACD line is above the zero line, it indicates an uptrend. When the MACD line is below zero line, it implies a downtrend. This strategy works well in trending markets but can lead to false signals in ranging or neutral markets.
Read More:
What is a Trending & Ranging Market?
Tips for using the MACD indicator
Below are some tips to keep in mind when using the MACD indicator in forex trading:
- Use the MACD indicator with technical analysis tools and other indicators to confirm signals.
- Avoid using the MACD indicator in a manipulating or ranging market, as it can generate false signals.
- Adjust the MACD indicator settings to suit your trading style and your trading time frame. For example, if trading on a higher time frame, you may want to use a longer moving average (EMA) period for the MACD line.
- Always use suitable capital and risk management techniques to minimize losses and maximize profits, such as setting stop-loss and take-profit orders.
Summary
MACD is a powerful technical indicator that can help traders identify trends and possible entry and exit points. Traders can make informed trading decisions and increase their chances of success by understanding how to read the MACD and interpret its signals. However, it is crucial to remember that no indicator is perfect, and traders should always use multiple indicators and analysis methods to verify signals and identify potential trading opportunities.