The moving average is one of the most widely used technical analysis indicators in Forex trading. This tool is simple to use and can provide valuable insight into market analysis. However, like any other indicator, moving averages can be misinterpreted and lead to costly mistakes. In this article, we will comprehensively discuss the following:
What is a Moving average?
Moving average is a common technical indicator that calculates a currency pair’s average price in a certain period. This tool’s epithet is moving because it is constantly updated by capturing new data and removing older data, reflecting the current market conditions. For instance, a 50-day moving average is calculated by considering a currency pair’s average price over the past 50 days.
Moving average Types
There are different types of moving averages used in forex trading. The most common are:
- Simple moving average (SMA)
- Exponential moving average (EMA)
- Weighted moving average (WMA)
Choosing the moving average type depends on the trader’s technique and preference. Further, we will explain each one in detail.
Simple Moving Average (SMA):
The most basic form of moving average is the Simple moving average. It is calculated by taking the sum of a currency pair’s closing prices in a certain period and dividing it by the number of periods. For instance, when using a 50-day moving average, the SMA is calculated by adding up the currency pair’s closing prices over the past 50 days and dividing by 50. The advantage of using a simple moving average is that it is easy to calculate and understand. However, it can be slower to react to price changes compared to other types of moving averages.
Exponential Moving Average (EMA):
Exponential moving average is a more complex form of moving average. It gives more weight to recent price data, and compared to a SMA it becomes more sensitive to price changes. The formula for calculating the EMA involves using a coefficient that gives more weight to recent price data. For instance, if you use the 50-day EMA, the coefficient will be 0.038 = (50+1)/2. The value of the current EMA is calculated by taking the currency pair’s closing price for the existing day, multiplying it by the coefficient, and adding it to the previous day’s EMA multiplied by (1 – coefficient). The advantage of using the EMA is that it is more sensitive to recent price changes than the simple moving average. However, it can be more volatile and may produce more false signals.
Weighted Moving Average (WMA):
A weighted moving average is another form of moving average that gives more weight to recent price data. However, it uses a different weighting scheme compared to the EMA. Instead of using a coefficient, it assigns a weight to each price data point based on its position in the time series. For instance, if you use a 50-day WMA, the last day’s weight will be 50, the second day’s weight will be 49, and so on. The WMA’s current value is calculated by taking the sum of each closing price’s product and its corresponding weight and dividing it by the total weights. The advantage of using a WMA is that it gives more weight to recent price data and is more responsive to price changes than a simple moving average. However, it can be more volatile and may produce more false signals.
How to use moving averages in Forex trading
Moving averages can be used in various ways to help analyze the market and make informed trading decisions. Below are some common strategies for this indicator:
- Identifying trends
- Support and resistance levels
- Multi-moving average crossover
Further in the article, we explain these strategies.
Identifying Trends:
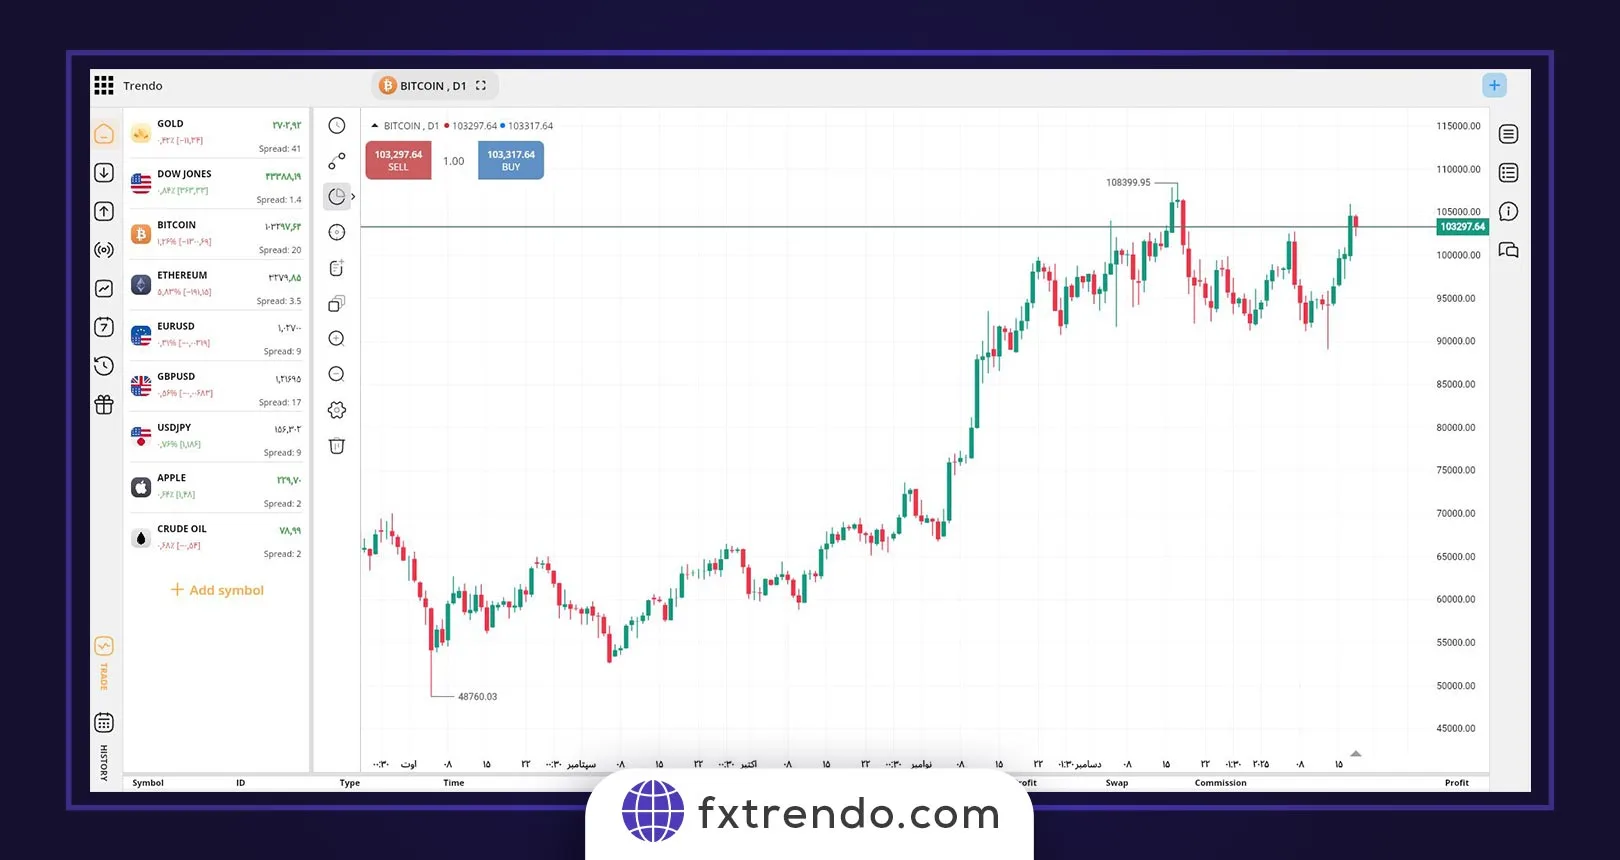
Moving averages can help identify the general trend in the forex market. When the price is consistently above the moving average line, it indicates an uptrend, and prices below the moving average line indicate a downtrend. Traders can use this information to enter trades in the trend direction and increase successful trade’s chance.
Read More:
What is a Trending & Ranging Market?
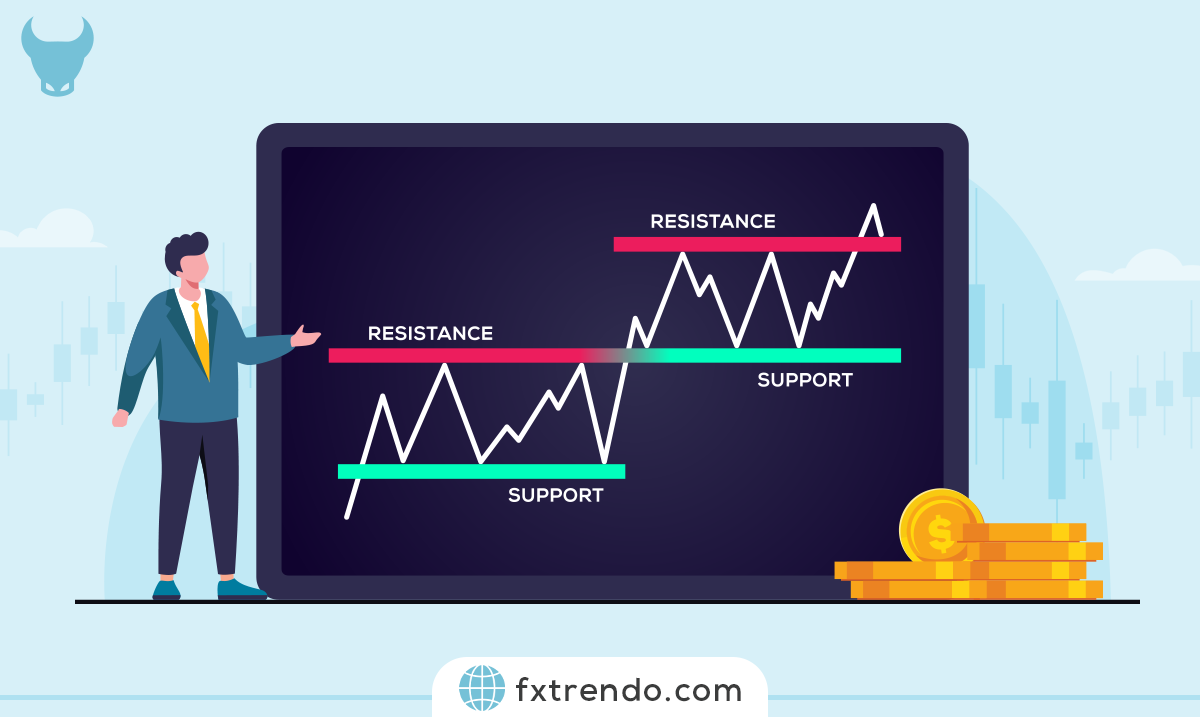
Support and Resistance Levels:
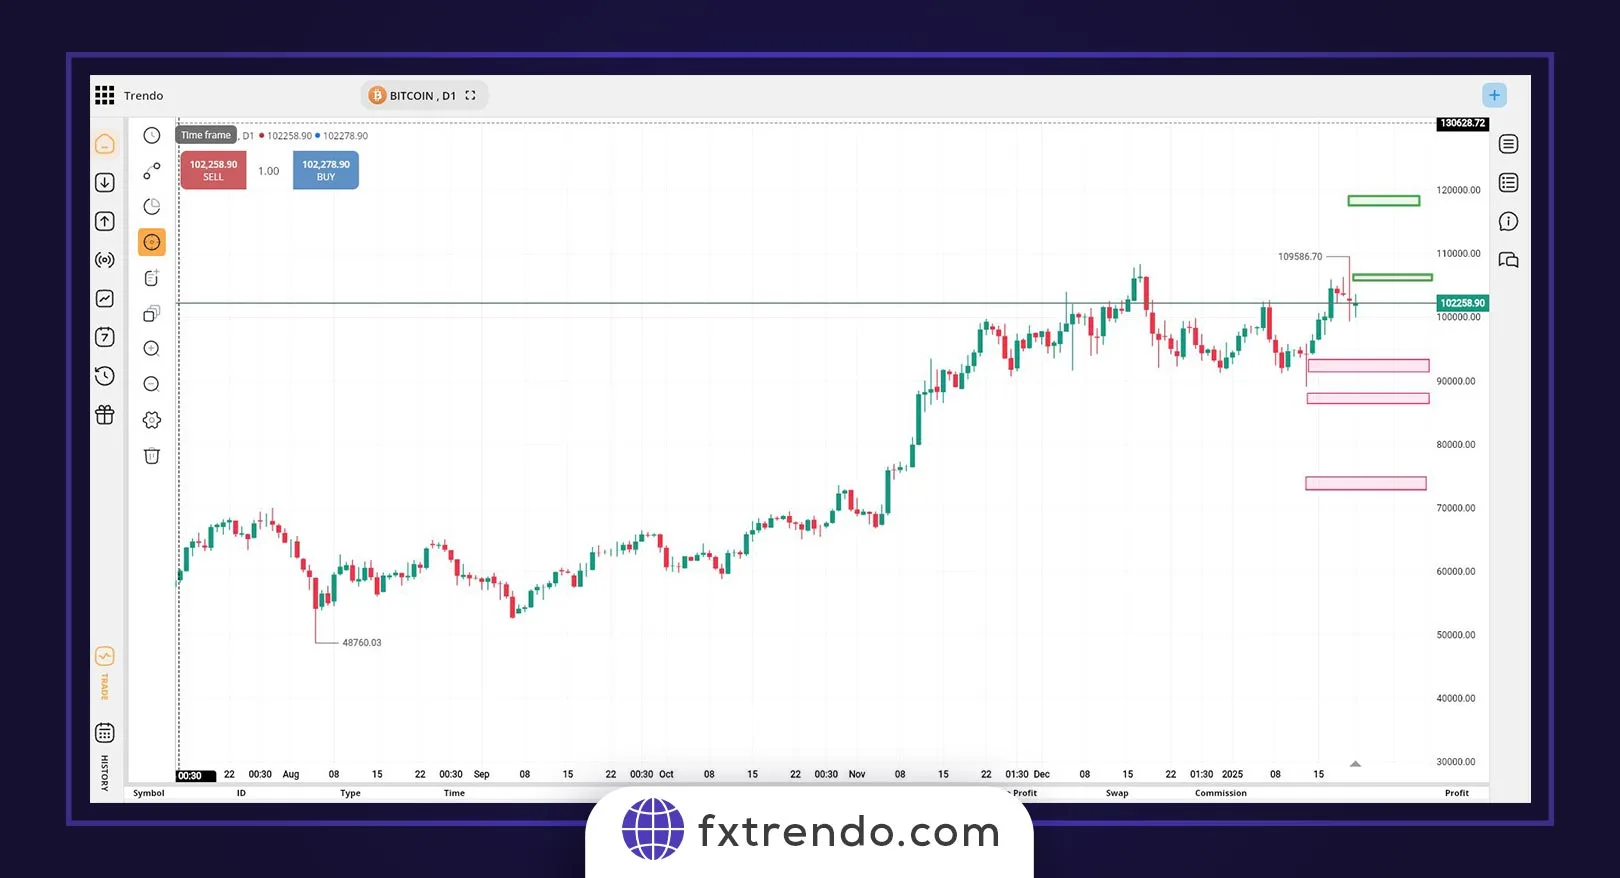
Moving averages can act as support or resistance levels and provide the basis for a reversal trend . For instance, when the price approaches the long-term moving average from the bottom, it can act as a support level and provide a buy opportunity. Conversely, when the price comes near the moving average from above, it can act as a resistance level and indicate a potential sell opportunity.
Multi-moving average crossover:
Another popular strategy is to use the moving average crossover. This method occurs when a short-term moving average, such as the 50-day moving average, crosses above or below a long-term moving average, such as the 200-day moving average. When the short-term moving average crosses above the long-term moving average, it generates a bullish signal, indicating a possible uptrend. Conversely, when the short-term moving average crosses below the long-term moving average, a bearish signal is generated, indicating a probable downtrend.
Common mistakes in using Moving average
Here, we will get into some common mistakes Forex traders make when using moving averages and how to avoid them. These mistakes include:
- Choosing the wrong type of moving average
- Using too many moving averages
- Using moving averages as an independent indicator
- Ignore the time frame
- Not setting moving averages
Here, we will explain these mistakes and the solution to fix them.
Choosing the wrong type of moving average:
The first mistake traders make when using moving averages is using the wrong moving average. As mentioned above, there are three types of moving averages: simple, exponential, and weighted. Traders often use the wrong moving average for current market conditions. For instance, traders should use the SMA when the market is volatile and manipulating because it does not give more weight to current price changes. However, if the market is trending, the EMA or WMA may be more suitable as it gives more weight to recent prices.
Using too many moving averages:
Another common mistake traders make is using too many moving averages. While using multiple moving averages seems to provide more insight into market trends, it can lead to confusion and false signals.
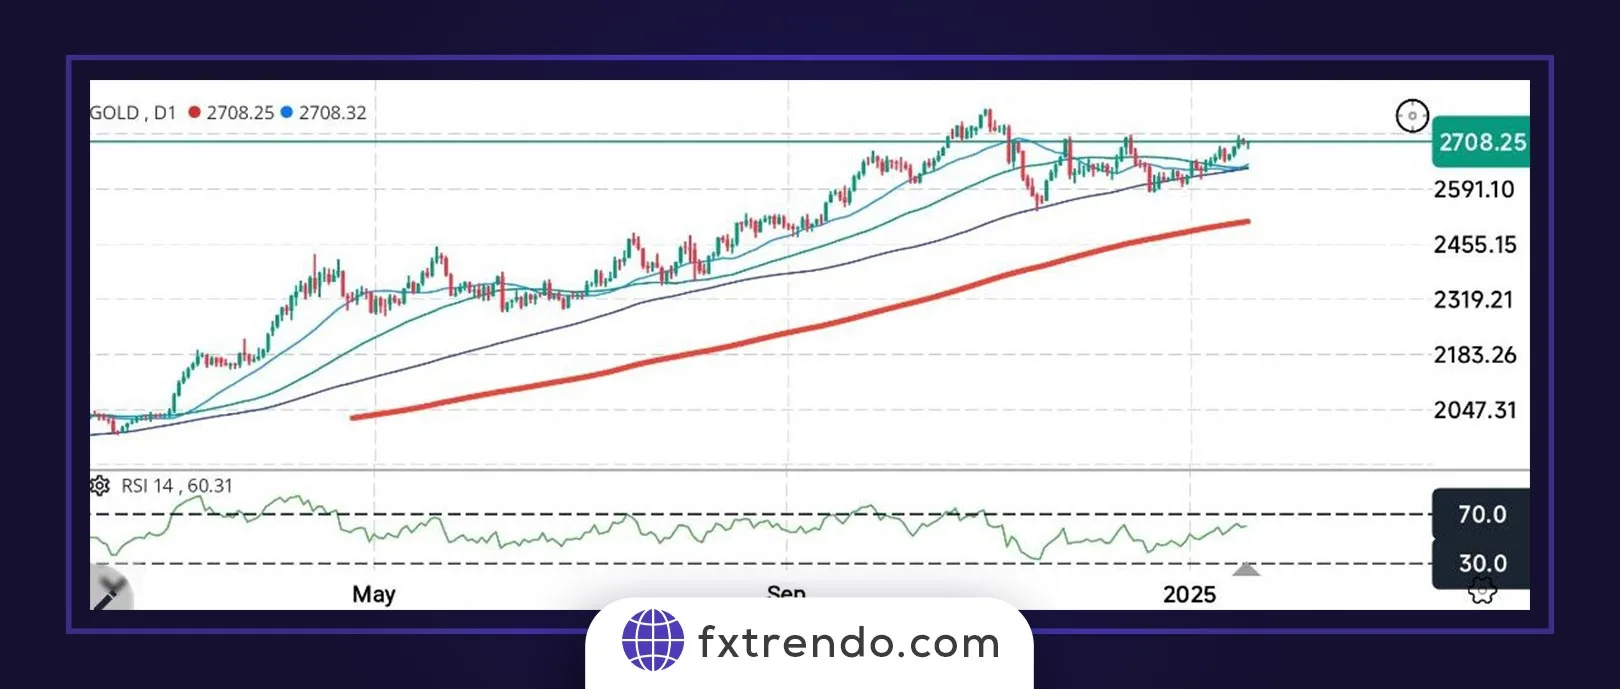
Traders must use at most two or three moving averages. The first moving average should be a short-term moving average, such as a 20-day EMA, to provide insight into short-term trends. The second moving average must be a long-term moving average, such as the 50-day SMA, to provide insight into long-term trends. Traders can also use a third-moving average, such as the 200-day SMA, as a signal line to confirm the trend.
Using moving averages as independent indicators:
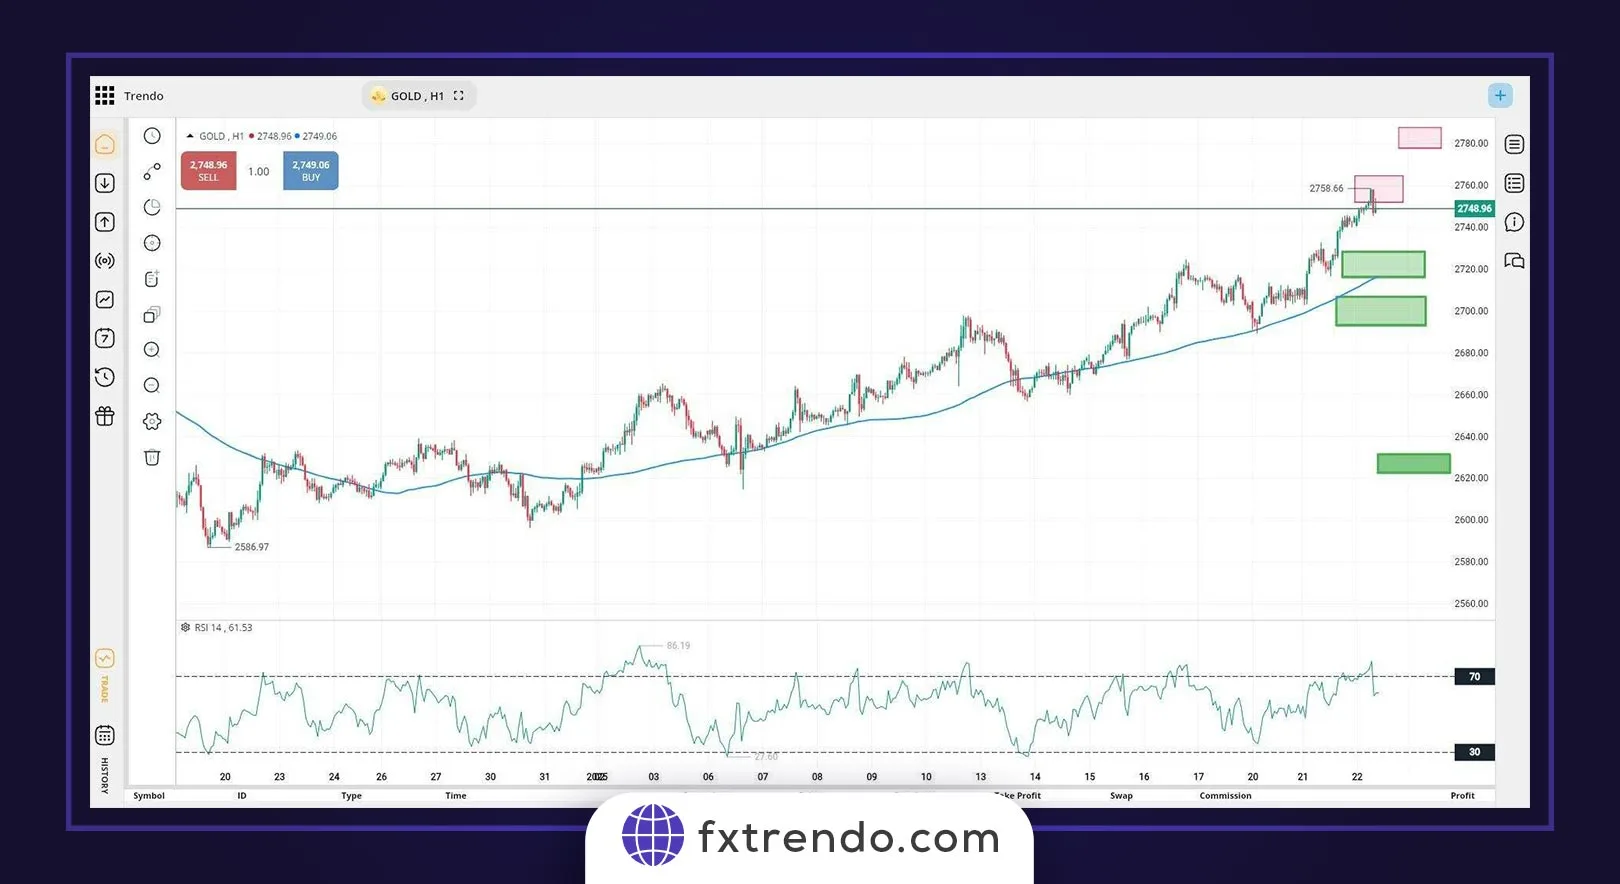
One must never use Moving averages as separate technical analysis tools. Traders must use it with other indicators, such as oscillators and trend lines to provide a more comprehensive analysis of market trends. For instance, traders can use the Relative Strength Index (RSI) to confirm the trend shown by the moving average. When the moving averages show an uptrend, but the RSI is in an overbought range, it may be a sign that the market is awaiting a price retracement.
Ignoring the Time Frame:
A usual mistake traders make when using moving averages is ignoring the time frame. Moving averages can provide different signals depending on the used time frame.
For Example:
the 50 SMA on a daily chart may indicate an uptrend, but the 50 SMA on a 5-minute chart may indicate a downtrend. Traders must always consider the time frame when using moving averages. They should also use multiple time frames to confirm the trend. For instance, when the 20-day EMA indicates an uptrend on the 1-hour chart, but the 20-day EMA indicates a bearish trend on the 15-minute chart, traders must be careful and wait for confirmation before placing a trade.
Read More:
What Is A Time Frame In Forex Trading? The Best Time Frame For Trading
Not setting moving averages:
In the end, traders often make the mistake of not setting a moving average for the currency pairs they are trading. Different currency pairs have different volatility levels, so using the same moving averages for all currency pairs can lead to false signals. Traders must set a moving average for the currency pair they are trading. For instance, a 20-day EMA might work well for a highly volatile currency pair like GBP/JPY, but a 30-day EMA might be more suitable for a less volatile currency pair like EUR/USD.
Trade with Golden and Death Cross
Golden and Death Cross are rare but powerful signals that traders count on. These events occur when the short-term and long-term moving averages cross.
Golden and Death Cross Signals have predicted some of the worst recessions of the 20th century. For instance, the Death Cross predicted bearish markets in 1929, 1938, 1974, and 2008. Regarding cryptos, these signals are popular because they emphasize the trend’s strength.
Golden Cross:
A golden cross occurs when the short-term moving average crosses above the long-term moving average. That signals to traders that they can expect a strong bullish move. In this strategy, traders use 50-day and 200-day moving averages.
As seen in the image and highlighted in green, a golden cross occurred on the March 2019 Bitcoin daily chart, indicating a powerful ascent away from the $3,122 floor. Since March 12, 2019, Bitcoin’s price has increased by 260%, from $3,859 to nearly $14,000 on June 26. The golden cross is more accurate when analyzing long-term time frames.
Death Cross:
The death cross is the opposite of the golden cross and occurs when the short-term moving average crosses the long-term moving average downward. Traders use 50-day and 200-day moving averages. As seen in the image, BTC showed more bearish conditions on March 30, 2018, as the 50-day moving average crossed below the 200-day moving average.
After this confluence, Bitcoin’s price fell 54%, from $6,850 to $3,122 on December 15. The death cross is more accurate when we use long-term time frames.
Trading strategies using 200-day SMA
The 200-day moving average is a significant tool for traders and market analysts to determine the general market trend. Here, we present the following strategies for using this tool.
- Simple SMA strategy
- Breakout Trading
- Trendline Trading
Further, we will explain these strategies along with examples.
Simple SMA Strategy:
This method is one of the most simple strategies widely used by traders. Most traders think that they have to follow complex strategies to make money from the market because it is hard to make money from the market. That is not true; You can make money using simple trading strategies.
For Buy
1- Look for an uptrend.
2- Wait for the SMA to move below the price.
3- Place the stop loss below the previous floor.
4- Consider the previous ceiling as the first target.
The image below shows a buy trade in the EURJPY currency pair.
For Sell
1- Look for a downtrend.
2- Sell when the SMA rises above the price.
3- Set the stop loss above the previous ceiling.
4- Consider the previous floor as the first target.
The image below shows a sell trade in the EURJPY currency pair.
Breakout Trading:
In a trending market, a breakout occurs when the price breaks a major level and stays above it. Breakout trading is a leading technique of trading the market, and you will always predict the market ahead of time by using this method.
For Buy
1- Look for an uptrend.
2- Wait for the SMA to move below the price.
3- After that, wait for the price retracement.
4- Let the price break the previous ceiling.
5 – Enter the trade.
6- Place the stop loss below the last floor.
The image below shows a buy trade in the EURJPY currency pair.
For Sell
1- Look for a downtrend.
2- Wait for the SMA to move above the price.
3- After that, wait for the price retracement.
4- Let the price break the previous floor.
5 – Enter the trade.
6- Place the stop loss above the last ceiling.
The image below shows the EURJPY currency pair’s downtrend.

Trendline trading:
This method requires drawing a trendline. After the moving average crosses the price, we wait for the trendline to form and break.
For Buy
1- Look for an uptrend.
2- Wait for the SMA to move below the price.
3- After that, wait for the price retracement towards the support area.
4- Draw the trendline.
5- Let the candles break the trendline.
6 – Enter the trade.
7- Place the stop loss below the support area.
8- Consider the previous ceiling as the first target.
The image below shows the CADJPY currency pair’s uptrend.

For Sell
1- Look for a downtrend.
2- Wait for the SMA to move above the price.
3- Then, wait for the price retracement towards the resistance area.
4- Draw the trendline.
5- Let the candles break the trendline.
6 – Enter the trade.
7- Place the stop loss above the resistance area.
8- Consider the previous floor as the first target.
The image below shows the sell trade in the GBPJPY currency pair.
Summary
While moving averages can be a powerful tool in forex trading, it is vital to understand their limitations. Moving averages are lagging indicators, meaning they are created based on past price data. As a result, they may not always accurately predict future price movements or provide timely signals. Therefore, it is significant to use moving averages along with other technical indicators and analysis tools to confirm trading signals.