Technical Analysis in Forex for 2025


Unlike fundamental analysis, which looks at economic factors and news, technical analysis aims to offer a clear picture of potential price behavior through tools such as price patterns, indicators, and theories like Elliott Waves.
In forex trading, understanding technical analysis is crucial as it empowers traders to identify opportunities, manage risks, and enhance their overall strategies. Whether you’re a seasoned trader or a newcomer, mastering technical analysis in forex is crucial for staying competitive.
In this article, we’ll explore the principles, history, and methodologies of technical analysis, offering practical guidance for forex traders at all levels. Join us to uncover the key to mastering this essential trading technique.
Contents
What is Technical Analysis in Forex?
Technical analysis is one of the primary methods used to analyze financial markets, especially popular among beginner traders due to its simplicity. This approach focuses on studying past price movements and trading volumes to predict future market trends.
The core belief behind technical analysis is that all the information needed to make trading decisions is already reflected in the price and market behavior. As a result, traders do not rely on analyzing news or evaluating economic conditions. Instead, they use charts and price patterns to forecast future market movements.
Technical analysis is built on three key principles:
1. Everything is reflected in price: Market prices encompass all relevant information, such as supply and demand, market sentiment, and external events.
2. Prices move in trends: Markets tend to follow identifiable trends, whether upward, downward, or sideways.
3. History repeats itself: Market patterns and behaviors often repeat over time, driven by consistent human psychology and market dynamics.
This method employs a variety of tools and techniques, such as charts, indicators, and price patterns, to interpret data. In the forex market, technical analysis is widely used to identify support and resistance levels, detect trends, and predict potential price reversals.
By mastering these techniques, traders can better determine optimal entry and exit points, improve risk management, and develop a deeper understanding of the market.
In the following sections, we’ll delve into the history of technical analysis and explore the essential tools and methods that traders can use to succeed in forex.
The History of Technical Analysis
Technical analysis has a rich history that spans centuries, evolving into a sophisticated method for understanding financial markets. Its journey can be divided into three key phases, reflecting its transformation from a basic practice to an advanced analytical tool used worldwide.
1. The Beginnings: 17th to 19th Century
The origins of technical analysis trace back to 17th-century Japan, where rice traders developed the first candlestick charts to predict price changes. These charts focused on identifying price patterns and interpreting market psychology, laying the groundwork for modern technical analysis.
In the late 19th century, Charles Dow, a journalist and co-founder of The Wall Street Journal, formalized many principles of technical analysis. His Dow Theory introduced the idea that all market information is reflected in prices, that prices move in trends, and that history tends to repeat itself. These principles remain foundational in technical analysis today. It is also worth noting that Charles Dow is also the founder of the Dow Jones Industrial Average.
2. The Development of Modern Technical Analysis in the 20th Century
The 20th century witnessed the rapid development of technical analysis, particularly between the 1930s and 1950s. Ralph Nelson Elliott’s Wave Principle introduced the Elliott Wave Theory, which emphasized repetitive price patterns driven by collective trader psychology.
During this time, tools like moving averages, the RSI, and MACD were developed, adding mathematical precision to chart analysis.
Books, articles, and dedicated studies on technical analysis flourished during this period, transforming it into a widely recognized discipline for analyzing financial markets.
3. The Rise of Technical Analysis in Forex
The emergence of the forex market in the 1970s marked a new era for technical analysis. With its high volatility, extensive historical data, and global nature, the forex market became a perfect environment for applying technical tools.
Advances in technology and the rise of online trading platforms like MetaTrader, TradingView, and Trendo have made technical analysis more accessible and efficient. Traders now utilize sophisticated charting tools, indicators, and even AI-driven algorithms to enhance precision and speed.
Today, technical analysis is not limited to forex; it is widely applied in stock markets, commodities, cryptocurrencies, and bonds. Its adaptability and predictive power make it an indispensable tool for traders and investors alike, cementing its importance across financial markets.
The Principles of Technical Analysis
Technical analysis is built on a systematic approach to understanding financial markets, with a foundation in three core principles. These principles guide traders in identifying opportunities and predicting future price movements, forming the backbone of technical tools and methods.
Let’s explore these key principles:
1. Everything is Reflected in Price
This principle asserts that all market information—whether economic, political, or psychological—is already reflected in the current price.
The interaction of supply and demand factors determines price levels, meaning traders do not need to analyze external news or fundamental data in detail. Instead, the price itself is seen as the ultimate indicator, representing the collective reaction of the market to all available information.
2. Price Moves in Trends
Technical analysis relies heavily on the idea that prices tend to move in identifiable trends rather than randomly fluctuating. These trends can be upward, downward, or sideways, and they typically persist until a significant force triggers a reversal.
Recognizing these trends helps traders align their strategies with the market’s direction, making it easier to identify entry and exit points.
3. History Repeats Itself
Another foundational concept is that market behavior tends to repeat over time. This repetition is driven by the collective psychology of traders, which often leads to similar reactions under comparable circumstances.
Patterns, such as head and shoulders or double tops, emerge because human behavior in financial markets is consistent. Understanding these patterns allows traders to anticipate potential price movements.
These principles remain timeless, providing a reliable framework for navigating the complexities of the forex market.
Types of Technical Analysis
Technical analysis offers a vast array of methods, each suited to different trading styles and objectives. Below are the most popular types, highlighting their unique characteristics and applications.
1. Classical Technical Analysis
Classical technical analysis focuses on identifying chart patterns and market structures to predict price movements. It primarily uses:
Chart Patterns: Patterns like head and shoulders, triangles, and double tops that signal potential price trends.
Trend Lines: Diagonal lines indicating the general direction of price movement, either upward or downward.
Support and Resistance Levels: Horizontal levels where prices are likely to pause or reverse due to supply or demand dynamics.
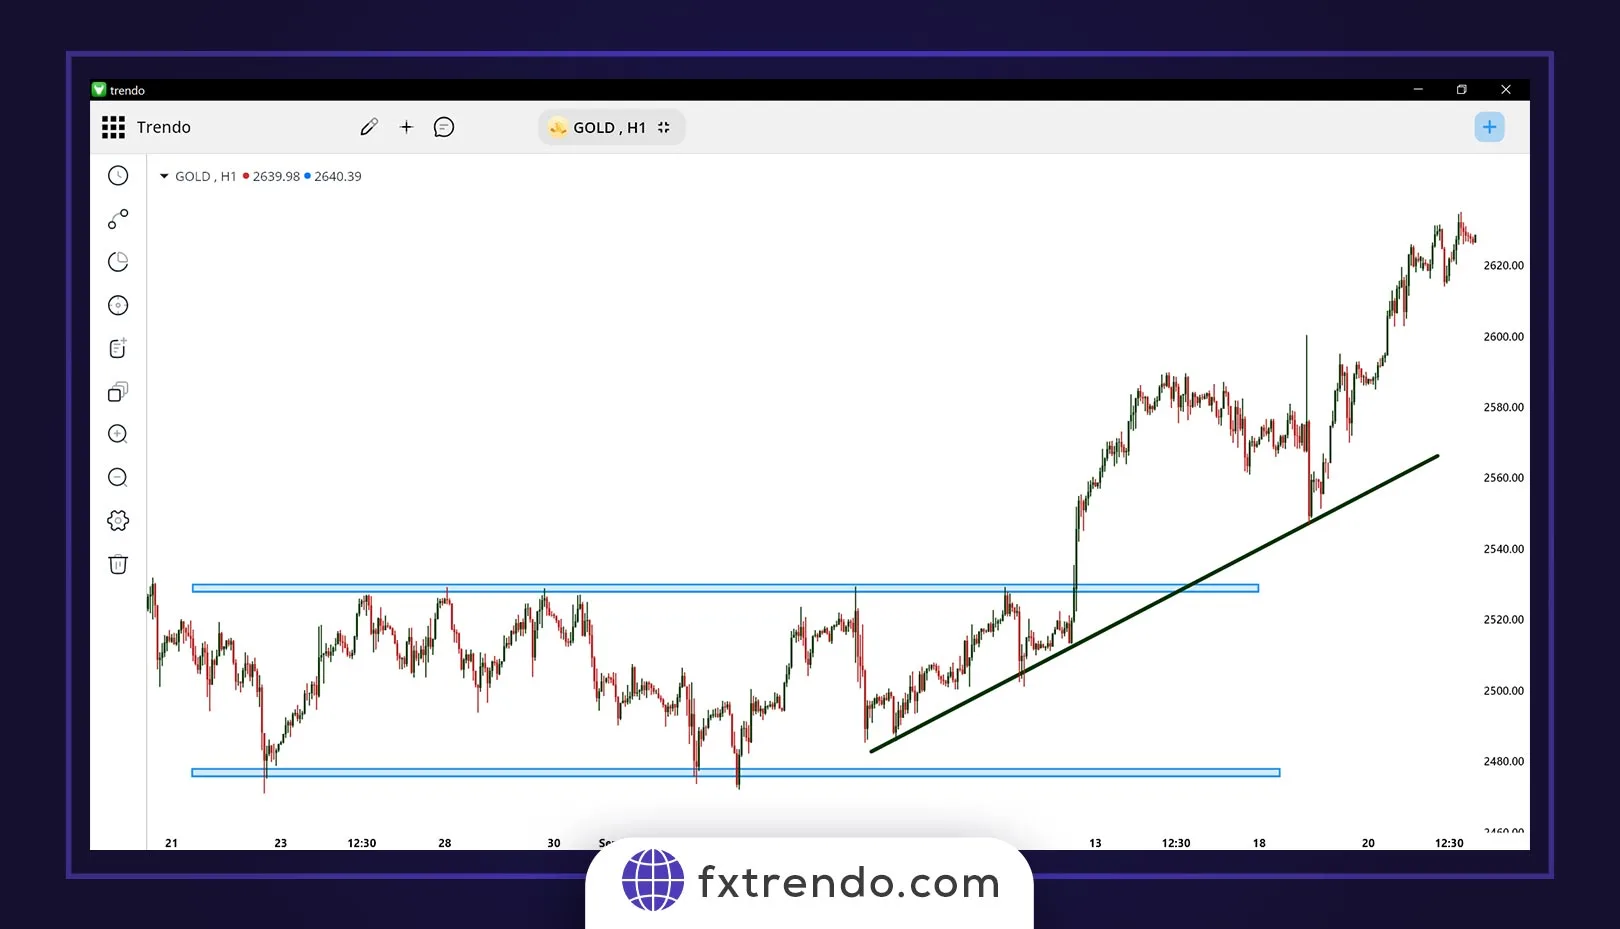
For example, in the image below of the gold symbol in Forex, we have used the H1 timeframe of classic technical analysis to predict price behavior:
2. Price Action
Price action is a purist approach that relies solely on price movements without using indicators. Traders analyze candlestick patterns, market trends, and structures to anticipate price behavior. Notable styles within price action include:
- ICT (Inner Circle Trader) Price Action
- Al Brooks’ Price Action Strategies
- RTM Price Action
- Sam Seiden Price Action
- Alfonso’s Supply and Demand Trading
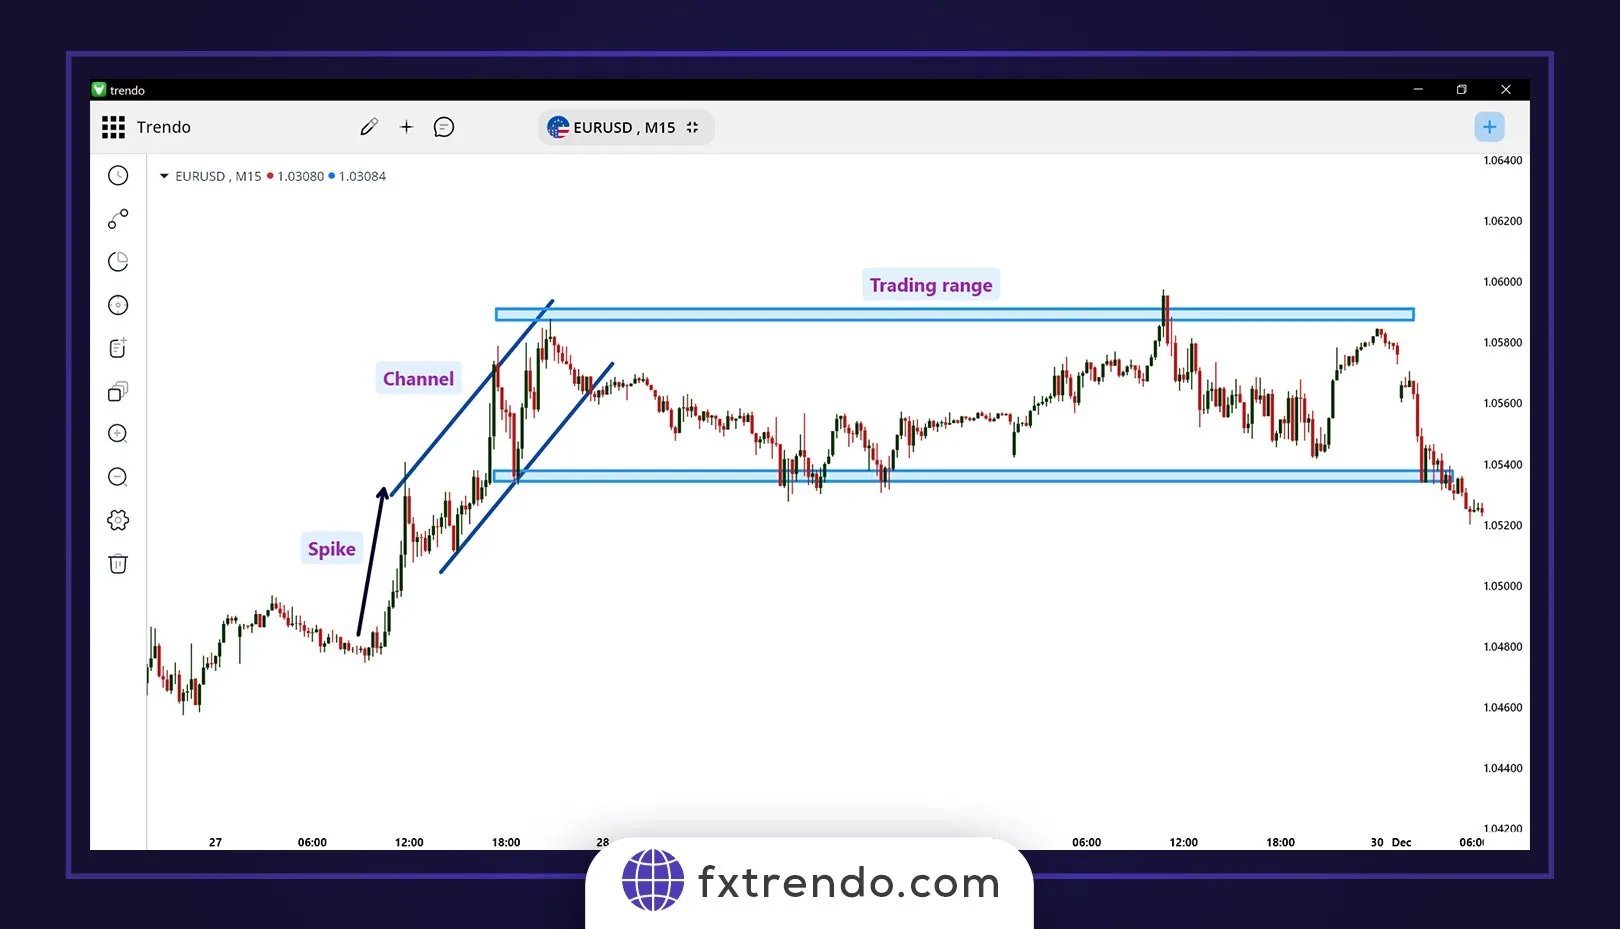
For example, as you can see in the image below, we have analyzed and examined the EUR/USD currency pair chart on the M15 timeframe based on the Al Brooks price action. In the Al Brooks trading style, the price moves in spike, channel, and range trading cycles:
3. Fibonacci and Harmonic Patterns
This method uses Fibonacci retracement levels (23.6%, 38.2%, 61.8%, etc.) to predict potential support and resistance zones. Harmonic patterns, like Butterfly, Bat, and Gartley, integrate these levels to identify reversal points and continuation zones with precision.
Read more: How to Use Fibonacci in Forex Trading? (Updated for 2025)
4. Elliott Wave Theory
Elliott Wave Theory was introduced by Ralph Nelson Elliott and is based on the idea that the market moves in repeating waves. It identifies two main wave types:
Impulse Waves: Aligning with the primary market trend.
Corrective Waves: Moving counter to the main trend. Understanding these waves helps traders predict long-term and short-term price cycles.
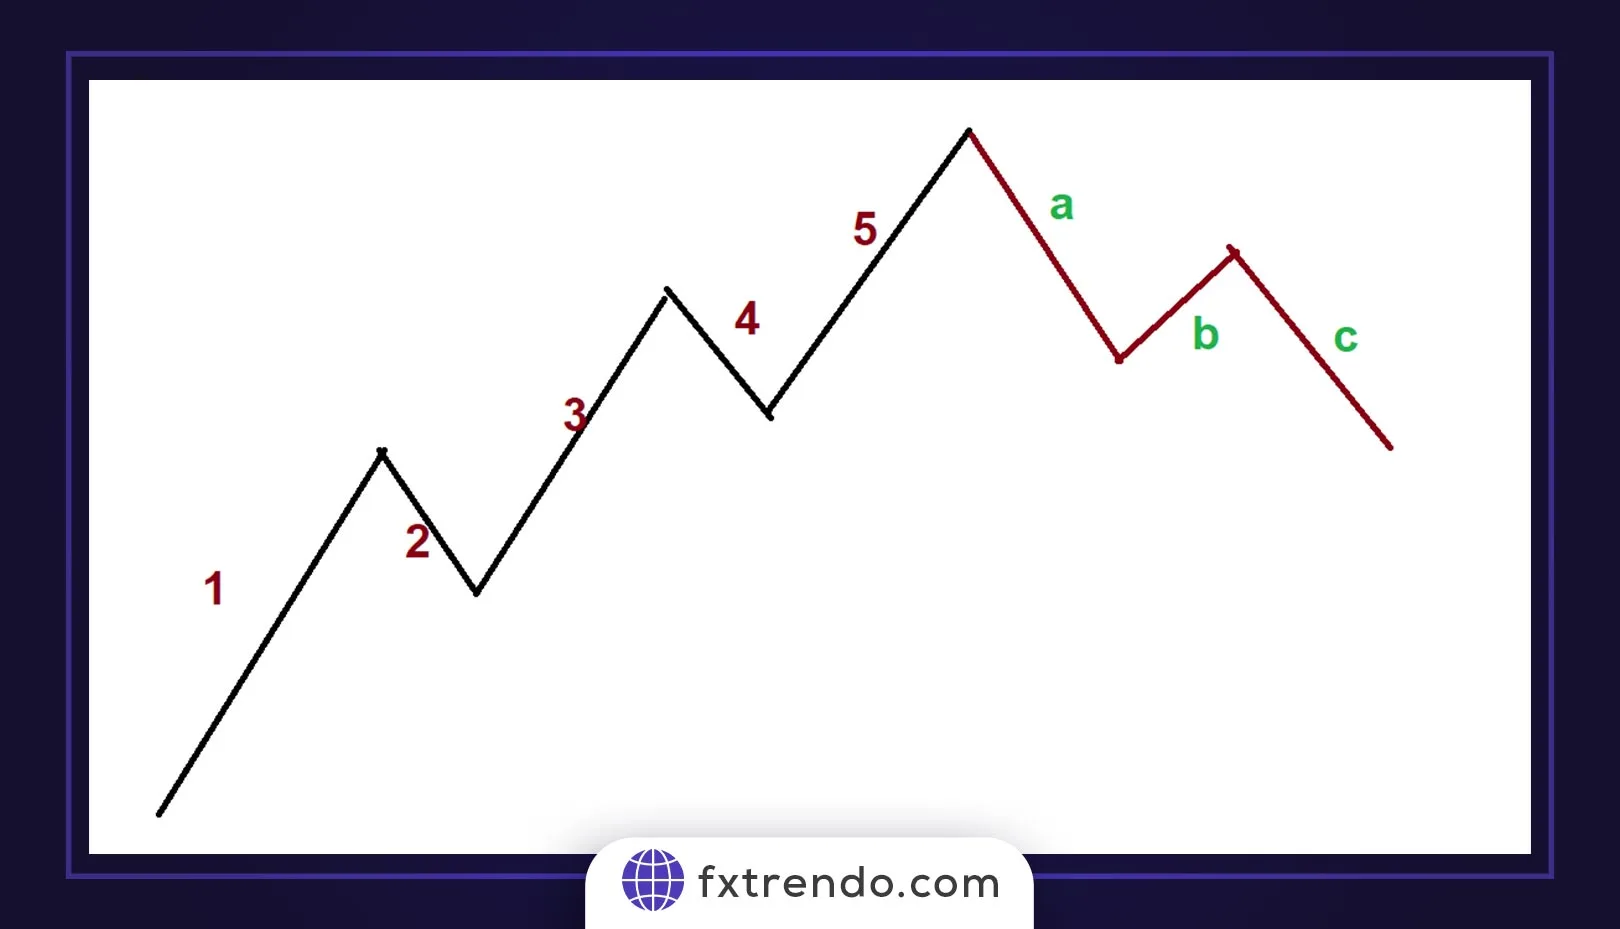
According to Elliott Wave Theory, the price moves in an 8-wave cycle, similar to the image below:
5. Indicators
Indicators are mathematical tools applied to price data, offering deeper insights into trends and momentum. Popular indicators include:
Moving Averages: Simplify price trends for easier identification.
MACD (Moving Average Convergence Divergence): Measures market momentum and trend direction.
RSI (Relative Strength Index): Evaluates whether a market is overbought or oversold.
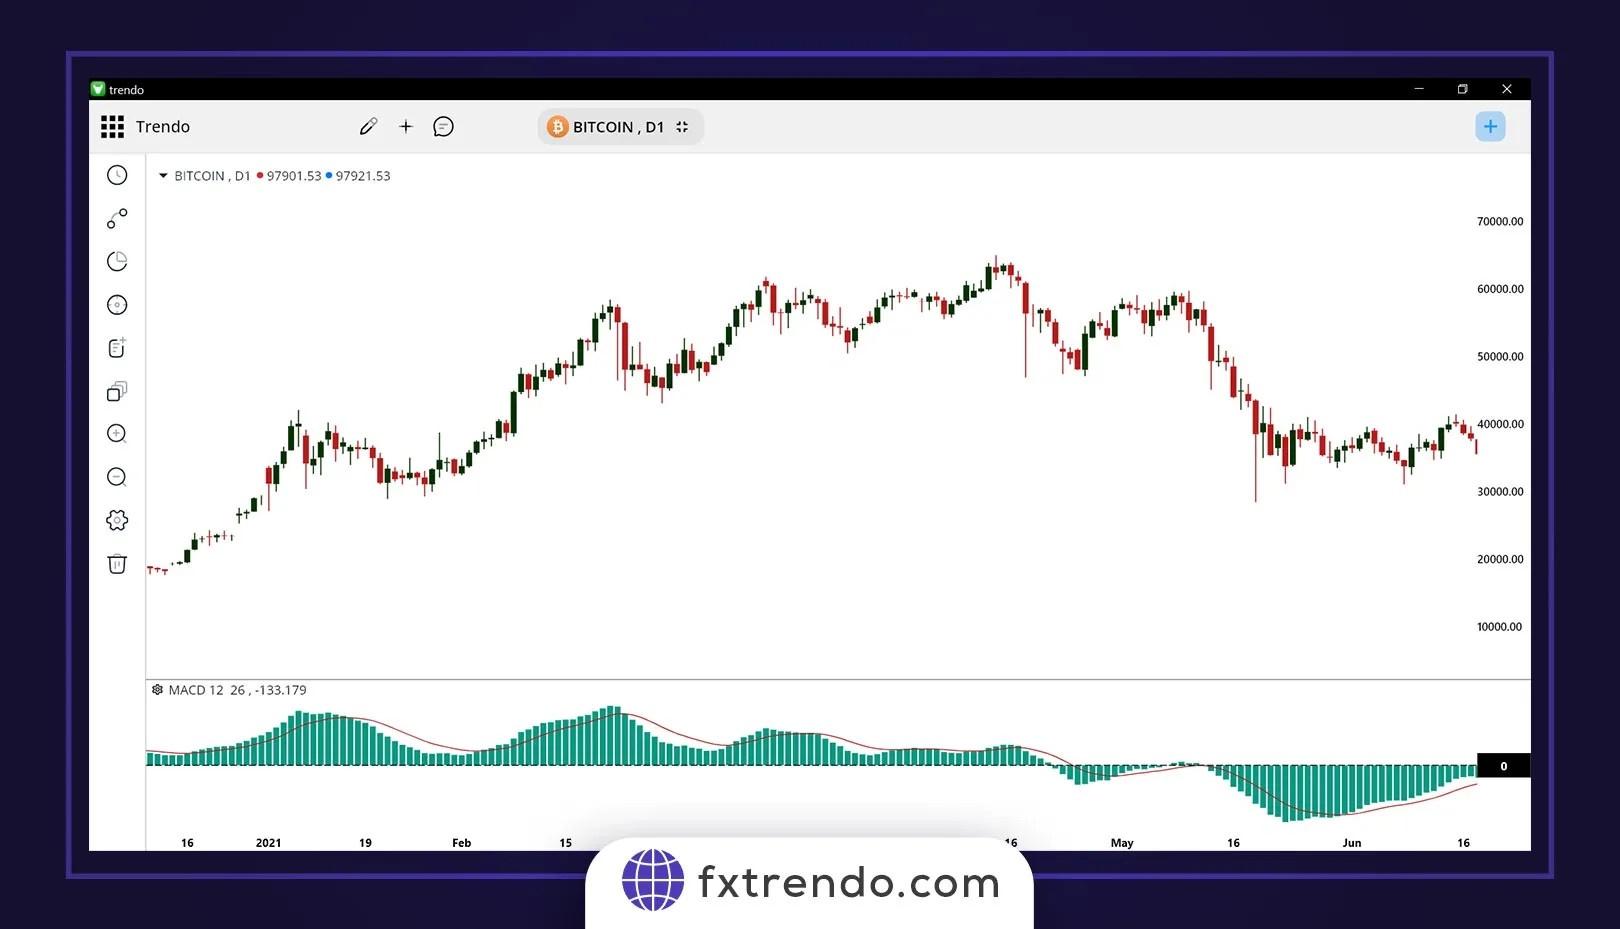
In the image below you can see the MACD indicator on the daily chart of Bitcoin (BTC):
6. Candlestick Patterns
Japanese candlestick patterns are highly effective for identifying market sentiment and potential reversals. Examples include:
Reversal Patterns: Hammer, Evening Star, and Shooting Star.
Continuation Patterns: Three White Soldiers and Three Black Crows, which indicate trend strength and persistence.
Each method has its strengths and applications, enabling traders to choose the approach that aligns with their strategy and market perspective.
Multi-Time Frame (MTF) or Time Analysis in Technical Analysis
Time analysis is an advanced technique in technical analysis that focuses not only on price movement but also on predicting when significant price changes are likely to occur. This method helps traders determine the exact timing of market shifts, providing an additional layer of insight beyond just the direction of price movements.
Time analysis is based on the concept that markets move in repetitive cycles of both time and price.
A key aspect of time analysis in forex is the use of time cycles. These cycles are derived from the observation that price movements often occur within specific time intervals, repeating patterns at regular intervals. Traders use these patterns to predict when the next significant price shift might take place.
One popular tool used in time analysis is the Fibonacci Time Zones. This tool applies Fibonacci ratios to time, identifying potential future reversal points based on historical price cycles. Just like Fibonacci retracement levels help identify potential price support and resistance, Fibonacci Time Zones highlight potential areas where significant market moves are likely to happen.
By combining time cycles with price movement analysis, multi-time frame (MTF) analysis can provide a more precise outlook for traders.
Traders can look at multiple time frames to see the overall market direction on longer time scales, while also pinpointing the best moments for entering or exiting trades on shorter time frames. This combination allows for better timing and more effective trade execution.
The Advantages and Disadvantages of Technical Analysis in Forex
Technical analysis is widely used in Forex trading, offering several advantages, but also posing some challenges. Here, we will explore both the benefits and limitations of this approach.
Advantages of Technical Analysis in Forex
1. Simplicity and Understanding
One of the main advantages of technical analysis is its simplicity. The tools and concepts used, such as charts, trends, and indicators, are easy to understand even for beginners. This makes technical analysis an accessible method for traders at all experience levels.
2. Availability of Educational Resources
There is a vast amount of learning material available for those who wish to master technical analysis. From online tutorials to expert forums and books, aspiring traders can find numerous resources to help them grasp the concepts and techniques involved in technical analysis.
3. Applicability Across All Time Frames
Technical analysis can be applied to various time frames, whether you are trading on a short-term or long-term basis. Traders can use technical analysis on different charts, from minutes to daily or weekly charts, making it versatile for different trading strategies and preferences.
4. Precise Entry and Exit Points
Technical analysis helps traders identify precise entry and exit points based on patterns, indicators, and trends. This level of detail can enhance trade timing and decision-making, offering the potential for more profitable trades.
Disadvantages of Technical Analysis in Forex
1. False Signals in Volatile Markets
One of the main drawbacks of technical analysis is its susceptibility to false signals, especially in highly volatile markets. Price movements can be erratic and unpredictable, leading to inaccurate predictions or misleading signals.
2. Subjectivity of Interpretation
Technical analysis relies heavily on interpretation, which can vary from trader to trader. Different traders might draw different conclusions from the same chart, which introduces a level of subjectivity into decision-making.
3. Neglect of Fundamental Factors
Technical analysis focuses primarily on price movements and patterns, often ignoring fundamental factors that can drive market changes, such as economic news, geopolitical events, or central bank policies. This can sometimes lead to a limited understanding of the broader market context.
4. Requires Experience and Practice
While the tools of technical analysis may be simple to learn, effectively applying them requires experience and constant practice. Successful technical analysis depends on the trader’s ability to interpret charts correctly and recognize patterns, which can take time to master.
While technical analysis provides a useful framework for traders in the Forex market, it is not without its limitations. Traders need to be aware of both its strengths and weaknesses and consider supplementing it with other methods or information to improve their overall trading strategy.
Technical vs. Fundamental Analysis in Forex
When it comes to trading in the Forex market, two main approaches dominate: technical analysis and fundamental analysis. While each method takes a different perspective on market movements, they can complement each other to provide a more comprehensive understanding of the market.
Let’s explore how both approaches work and how they differ from one another.
Technical Analysis in Forex
Technical analysis focuses on historical price data and trading volume to forecast future price movements. Traders use charts, indicators, and patterns to analyze past price trends, believing that market behavior repeats itself over time.
This approach relies on the idea that all relevant information, including economic data and market sentiment, is already reflected in the price, and thus the future movement of an asset can be predicted by examining its price history.
Key tools used in technical analysis include:
- Charts (Candlestick, Line, and Bar charts)
- Indicators (Moving Averages, MACD, RSI)
- Price Patterns (Head and Shoulders, Triangles, Double Tops/Bottoms)
Technical analysis is often favored by short-term traders or those focusing on specific entry and exit points, as it helps pinpoint precise price levels.
Fundamental Analysis in Forex
Fundamental analysis, on the other hand, is based on understanding the underlying economic, political, and financial factors that influence the value of currencies. This method involves analyzing various economic reports, interest rates, inflation data, and geopolitical events to predict the future value of an asset.
Traders who rely on fundamental analysis believe that a currency’s value is determined by factors such as economic growth, inflation rates, and the fiscal policies of the country.
Some of the key components of fundamental analysis include:
- Economic Indicators (GDP, employment reports, inflation rates)
- Interest Rates (Central bank decisions on interest rates)
- Political and Global Events (Elections, wars, trade agreements)
Fundamental analysis is often used by long-term investors or those interested in understanding the broader market conditions that influence price movements over time.
Key Differences between Technical and Fundamental Analysis
Focus: Technical analysis centers around historical price movements, while fundamental analysis focuses on economic and political factors that drive price changes.
Time Horizon: Technical analysis is often used by short-term traders who want to make quick decisions, while fundamental analysis is generally used by long-term traders or investors seeking to understand the bigger picture.
Data: Technical analysis uses past price data and market sentiment, while fundamental analysis relies on economic reports, interest rates, and political events.
The Best Technical Analysis Strategy for Forex Traders
Choosing the right technical analysis strategy is essential for developing an effective trading strategy. The ideal strategy depends on factors such as trading goals, experience level, and trading style. In this section, we'll explore some tips to help you select the best technical analysis method for your Forex trading journey.
1) For Scalpers and Day Traders
Scalpers and day traders focus on making profits from short-term price movements within a single day. Since they need to make quick decisions, their strategies should rely on tools that can provide clear signals in a short time frame.
The following methods work well for these traders:
Price Action: Price action trading involves analyzing price movements without the use of indicators. By studying patterns, candlestick formations, and support and resistance levels, traders can predict short-term price movements effectively.
Indicators: Indicators such as the MACD (Moving Average Convergence Divergence) and RSI (Relative Strength Index) are particularly useful for identifying overbought or oversold conditions, helping traders decide when to enter or exit a position.
For scalpers, quick entry and exit points are critical, so relying on tools that signal price shifts rapidly is essential.
2) For Traders Focused on Long-Term Trends
Traders with an interest in longer-term trends should aim to understand the bigger market picture. Their strategies often rely on identifying and following major price trends that could unfold over weeks, months, or even years.
The following tools and techniques are beneficial for these traders:
Trend Lines: Using trend lines helps in identifying the general direction of the market. These lines connect higher lows in an uptrend and lower highs in a downtrend, assisting traders in recognizing trends over time.
Fibonacci Levels: Fibonacci retracements are widely used to find potential levels of support and resistance based on key Fibonacci ratios. These levels can help traders predict where price corrections might end, making them crucial for understanding long-term trend reversals.
Elliott Waves: Elliott Wave theory is another tool used to predict long-term price movements. It operates on the belief that market prices follow predictable wave patterns, which traders can use to forecast future price movements.
By using these tools, long-term traders can make informed decisions on when to enter or exit trades based on major trends and key reversal points.
3) For Beginners: Start with the Basics
If you're just starting out in Forex trading, it's important to begin with simpler strategies that help build your skills gradually.
Start by learning the fundamentals of technical analysis and become comfortable with basic tools before moving on to more advanced methods.
Classic Technical Analysis: Basic chart patterns like head and shoulders, triangles, and double tops/bottoms are essential for identifying price movements and trends.
Trend Lines: Understanding how to draw and interpret trend lines is key for recognizing price trends in the market.
Moving Averages: Simple Moving Averages (SMA) or Exponential Moving Averages (EMA) are great tools for smoothing out price data, making it easier to identify trends and potential entry/exit points.
By starting with these simple tools, beginners can gradually build a foundation of technical analysis knowledge and feel confident as they move to more complex strategies over time.
4) Combining Multiple Tools for Better Results
Often, the best results come from combining various tools and techniques to confirm signals and make more accurate decisions. For example, combining indicators with price action can help traders pinpoint more precise entry and exit points. Here’s why this works:
Indicators : can provide insights into the market’s momentum, showing whether a trend is strong or weakening.
Price action : gives traders a deeper understanding of market psychology and helps interpret the context in which a trend is occurring.
By using these tools together, traders can increase their chances of success and reduce the risk of making false predictions.
The best technical analysis strategy is one that aligns with your personal trading style, goals, and experience level.
Conclusion
In this article, we provided a comprehensive introduction to technical analysis. Technical analysis and fundamental analysis are the two main pillars for decision-making in the Forex market.
Although these two methods differ in their approach and tools, they share a common goal: helping traders better understand market behavior and predict future price movements. A smart combination of these two types of analysis offers traders a holistic perspective, increasing the chances of success.
Finally, remember that learning trading methods is an endless journey. Markets are constantly changing, and only traders who are committed to continuous learning can take advantage of these changes. In this process, practice, repetition, and journaling will be the key to your progress.
Frequently Asked Questions
1. What is the role of technical analysis in Forex?
2. How long does it take to become proficient in technical analysis?
3. How does time analysis help in predicting market trends?
4. Is technical analysis always accurate?
پست مرتبط
پربازدیدترین ها
0


