


What Are Pivot Points? The Ultimate Guide to Pivot Points in Forex

Everything about Pivot Points in the Forex Market.
So, what exactly are pivot points? In simple terms, pivot points are calculated using the previous day’s high, low, and closing prices. They help traders determine the overall market trend and identify key levels where the price might change direction.
In this guide, we’ll explore everything you need to know about pivot points. You’ll learn how to calculate them, understand their significance, and discover how to use them effectively in your trading strategy.
By the end of this guide, you’ll be equipped with the knowledge to make more informed trading decisions and enhance your forex trading skills.
Let’s dive in and unlock the power of pivot points!
Contents
What Are Pivot Points in Forex?
Pivot points are a popular technical analysis tool used by forex traders to identify potential support and resistance levels in the market. These points are calculated using the high, low, and closing prices of the previous trading day. Pivot points help traders determine the overall market trend and predict where the price might move next.
The main pivot point is the average of the high, low, and closing prices from the previous day. From this central pivot point, additional support and resistance levels are calculated. These levels indicate where the price might encounter obstacles or find support, helping traders make more informed decisions.
Whether you’re a beginner or an experienced trader, incorporating pivot points into your trading strategy can provide valuable insights and improve your chances of success in the forex market.
Read more: Support and resistance levels and how to draw them
How to Calculate Pivot Points in Forex?
Calculating pivot points in forex is straightforward and can be done using a simple formula. Here’s how you can do it:
1. Gather Data: You need the high, low, and closing prices from the previous trading day.
2. Calculate the Pivot Point (P): Use the formula: [P = (High + Low + Close)/3]. This gives you the main pivot point, which is the average of the high, low, and closing prices.
3. Calculate Support and Resistance Levels:
First Support Level (S1): [ S1 = 2P - High ]
First Resistance Level (R1): [ R1 = 2P - Low ]
Second Support Level (S2): [ S2 = P - (High - Low) ]
Second Resistance Level (R2): [ R2 = P + (High - Low) ]
4. Analyze the Levels
With your pivot point and support/resistance levels, analyze the market:
- If the price is above the pivot point, it often indicates a bullish trend, suggesting a buying opportunity.
- If the price is below the pivot point, it may indicate a bearish trend, suggesting a selling opportunity.
These calculations help you identify key levels where the price might find support or resistance. By using these pivot points, you can better understand market trends and make more informed trading decisions.
Whether you’re new to trading or have some experience, knowing how to calculate and use pivot points can enhance your trading strategy.
Types of Pivot Points
There are several types of pivot points used in forex trading, each with its own unique calculation method and application. Here are the most common ones:
1. Standard Pivot Points: These are the most widely used pivot points. They are calculated using the average of the high, low, and closing prices from the previous trading day. Standard pivot points provide a straightforward way to identify potential support and resistance levels.
2. Fibonacci Pivot Points: These pivot points incorporate Fibonacci retracement levels into their calculations. Traders use the Fibonacci sequence to predict potential price movements and identify key levels where the price might reverse.
3. Camarilla Pivot Points: Developed by Nick Stott in the 1980s, Camarilla pivot points use a different formula to calculate support and resistance levels. They focus on the idea that prices tend to revert to the mean, making them useful for identifying potential reversal points within a trading range.
4. Woodie’s Pivot Points: These pivot points give more weight to the closing price of the previous day. The calculation method is slightly different, emphasizing the importance of the closing price in predicting future price movements. Woodie’s pivot points are popular among day traders.
5. Demark Pivot Points: Named after Tom Demark, these pivot points use a different approach to calculate support and resistance levels. They focus on the relationship between the opening price and the previous day’s high and low prices. Demark pivot points are often used to identify breakout points.
Advantages and Limitations of Pivot Points
Pivot points are a popular tool among forex traders, offering several advantages and some limitations. Understanding these can help you make the most of pivot points in your trading strategy.
Advantages of Pivot Points
1. Simplicity: Pivot points are easy to calculate and use. With just the high, low, and close prices from the previous trading day, you can quickly determine key levels.
2. Predictive Power: Pivot points help traders identify potential support and resistance levels, making it easier to predict market movements and plan trades accordingly.
3. Versatility: Pivot points can be used in various markets, including forex, stocks, and commodities. They are also effective in different time frames, from intraday to long-term trading.
4. Objective Analysis: Since pivot points are based on mathematical calculations, they provide an objective way to analyze the market, reducing the influence of emotions and biases.
5. Enhanced Decision-Making: By incorporating pivot points into your trading strategy, you can make more informed decisions about entry and exit points, as well as potential price targets.
Limitations of Pivot Points
1. Static Nature: Pivot points are calculated using the previous day’s data, which means they do not account for real-time market changes. This can sometimes lead to outdated or less relevant levels.
2. Not Foolproof: While pivot points can provide valuable insights, they are not always accurate. Market conditions can change rapidly, and other factors can influence price movements.
3. Requires Confirmation: It’s essential to use pivot points in conjunction with other technical indicators and analysis methods. Relying solely on pivot points can lead to incomplete or misleading conclusions.
4. Limited in Trending Markets: Pivot points are more effective in ranging markets where prices move within a defined range. In strong trending markets, pivot points may not provide as much value.
How to Use Pivot Points in Forex Trading?
Pivot points are a valuable tool for forex traders, helping to identify potential support and resistance levels. Here’s how you can effectively use pivot points in your trading strategy:
Identifying Key Levels
Pivot points provide a central level (the pivot point) along with support and resistance levels. These levels can help you determine potential entry and exit points for your trades. The main levels to watch are:
Pivot Point (P): The central level calculated from the previous day’s high, low, and close prices.
Support Levels (S1, S2, S3): Levels below the pivot point where the price might find support.
Resistance Levels (R1, R2, R3): Levels above the pivot point where the price might face resistance.
Trading Strategies Using Pivot Points
1. Range Trading: In a ranging market, prices tend to move between support and resistance levels. You can use pivot points to identify these levels and trade within the range. For example, you might buy near a support level (S1) and sell near a resistance level (R1).
2. Breakout Trading: When the price breaks through a pivot point or a support/resistance level, it can signal a strong move in that direction. You can use pivot points to identify potential breakout levels and enter trades accordingly. For instance, if the price breaks above R1, you might consider entering a long position.
3. Trend Trading: Pivot points can also help you identify the overall trend. If the price is consistently above the pivot point, it indicates a bullish trend. Conversely, if the price is below the pivot point, it suggests a bearish trend. You can use this information to align your trades with the prevailing trend.
Read more: What are the trading hours of different types of international financial markets?
Combining Pivot Points with Other Indicators
While pivot points are powerful on their own, combining them with other technical indicators can enhance your trading strategy. For example:
Moving Averages: Use moving averages to confirm the trend direction indicated by pivot points.
Relative Strength Index (RSI): Use RSI to identify overbought or oversold conditions near pivot points.
Candlestick Patterns: Look for candlestick patterns near pivot points to confirm potential reversals or continuations.
Practice and Adaptation
Like any trading tool, pivot points require practice and adaptation. Start by incorporating them into your trading routine and observe how they perform in different market conditions. Over time, you’ll develop a better understanding of how to use pivot points effectively.
Pivot Points vs. Other Indicators
Pivot points are unique compared to other technical indicators because they provide specific price levels that can act as support or resistance. Here’s how they compare to other common indicators:
1. Moving Averages: Moving averages smooth out price data to identify trends over time, while pivot points give precise levels where price reversals might occur. Moving averages are lagging indicators, following price movements, whereas pivot points are leading indicators, predicting potential turning points.
2. Relative Strength Index (RSI): RSI measures the speed and change of price movements to identify overbought or oversold conditions. Unlike pivot points, which provide specific price levels, RSI gives a value between 0 and 100 to indicate market momentum. Pivot points focus on price levels, while RSI focuses on market strength.
3. Bollinger Bands: Bollinger Bands consist of a moving average and two standard deviation lines. They help traders understand volatility and potential price breakouts. Pivot points offer clear support and resistance levels without considering volatility. Bollinger Bands identify price extremes, while pivot points pinpoint exact levels.
4. MACD (Moving Average Convergence Divergence): MACD shows the relationship between two moving averages of a security’s price. It helps identify changes in the strength, direction, momentum, and duration of a trend. Pivot points provide specific levels for potential price reversals, making them more straightforward for setting entry and exit points.
Each indicator has its strengths and weaknesses. Pivot points are useful for identifying key price levels, while other indicators like moving averages, RSI, Bollinger Bands, and MACD offer different insights into market trends and conditions.
Best Timeframes for Pivot Points in Forex
Choosing the right timeframe for using pivot points in forex trading can significantly impact your trading success. Here are some of the best timeframes to consider:
1. 15-Minute Chart: This is a popular choice for day traders who want to capture short-term price movements. The 15-minute chart provides a good balance between detail and broader market trends, making it easier to identify potential entry and exit points.
2. 1-Hour Chart: The 1-hour chart is another favorite among traders. It offers a clearer view of the market’s overall direction while still providing enough detail for making informed trading decisions. This timeframe is particularly useful for identifying key support and resistance levels.
3. Daily Chart: For those who prefer a longer-term perspective, the daily chart is ideal. It helps traders understand the broader market trends and make decisions based on more significant price movements. Pivot points on daily charts are often used to set longer-term trading strategies.
4. 5-Minute Chart: If you’re looking for very short-term trades, the 5-minute chart can be useful. It allows you to see quick price movements and make rapid trading decisions. However, this timeframe can be more volatile and may require more attention.
5. Weekly Chart: For swing traders and those looking at longer-term trends, the weekly chart provides a comprehensive view of the market. Pivot points on weekly charts help identify major support and resistance levels that can influence trading decisions over several days or weeks.
Common Mistakes to Avoid When Using Pivot Points
Using pivot points can be effective, but there are common mistakes to avoid:
1. Ignoring Other Market Factors: Relying solely on pivot points without considering economic news or geopolitical events can lead to poor decisions. Always incorporate broader market analysis.
2. Overtrading: Placing too many trades based on pivot points alone can lead to overtrading, increasing transaction costs and risk. Use pivot points as part of a balanced strategy.
3. Not Combining with Other Indicators: Pivot points work best when combined with other indicators like Moving Averages, RSI, or MACD. This provides more reliable signals and reduces the risk of false entries.
4. Ignoring the Overall Trend: Use pivot points in the context of the overall market trend. Trading against the trend can be risky, even if pivot points suggest support or resistance levels.
5. Misinterpreting Levels: Misunderstanding pivot points and their support and resistance levels can lead to incorrect decisions. Ensure you understand how these levels work and practice interpreting them correctly.
6. Lack of Practice: Jumping into live trading without sufficient practice can be detrimental. Use demo accounts to practice and understand pivot points in different market conditions before trading with real money.
By avoiding these mistakes, you can use pivot points more effectively and improve your trading strategy.
Pivot Point Trading Tips for Beginners
Starting with pivot points in forex trading can be a game-changer. Here are some tips to help beginners make the most of this tool:
1. Understand the Basics: Know what pivot points are and how they are calculated. This foundational knowledge is crucial for effective use.
2. Start with Standard Pivot Points: Begin with standard pivot points as they are the most straightforward to calculate and use. Once you’re comfortable, explore other types like Fibonacci or Camarilla pivot points.
3. Use Multiple Timeframes: Check pivot points on different timeframes to get a comprehensive view of the market. For example, use daily pivot points for overall trends and 15-minute pivot points for intraday trading.
4. Combine with Other Indicators: Enhance your analysis by combining pivot points with other technical indicators like Moving Averages, RSI, or MACD. This can provide more reliable trading signals.
5. Practice on a Demo Account: Before risking real money, practice using pivot points on a demo account. This allows you to understand how they work in different market conditions without financial risk.
6. Set Clear Entry and Exit Points: Use pivot points to set clear entry and exit points for your trades. This helps in managing risk and maximizing potential profits.
7. Stay Updated on Market News: Keep an eye on economic news and events that can impact the forex market. Pivot points are based on past price data, so staying informed about current events is essential.
8. Be Patient and Disciplined: Trading with pivot points requires patience and discipline. Stick to your trading plan and avoid making impulsive decisions based on short-term market movements.
By following these tips, beginners can effectively use pivot points to enhance their forex trading strategy and make more informed decisions.
Conclusion
While pivot points are widely used by traders, they are still just one indicator and cannot guarantee profitability on their own. The path to successful trading is more complex than relying on a few technical analysis tools.
You need to learn various styles (preferably from a successful trader, not from those selling packages) and eventually develop your own unique trading style.
Remember, unique doesn’t mean complicated. Trading is simple, but it’s not easy.
FAQs
What are pivot points?
Can pivot points be used in other markets besides Forex?
What is the best pivot point strategy?
Are pivot points reliable?
Which pivot points are best for swing trading?
What is pivot S1 S2 R1 R2?
How to calculate pivot point in forex?
Do professional traders use pivot points?
How to choose a pivot point?
When to buy with pivot point?
Related Post

What is the Best Leverage in Forex? Learn Everything about Best Leverage in Forex
Navigating the world of forex trading can be both exciting and daunting, especially when it comes to understanding leverage.
Ultimate Guide to Zero Spread in Forex - The Best Broker with Zero Spread in Forex
In the bustling world of Forex trading, the term zero spread often sparks a wave of interest. It’s a concept that promises the pinnacle of efficiency in currency trading. But what exactly is zero spread, and why does it matter so much to traders?
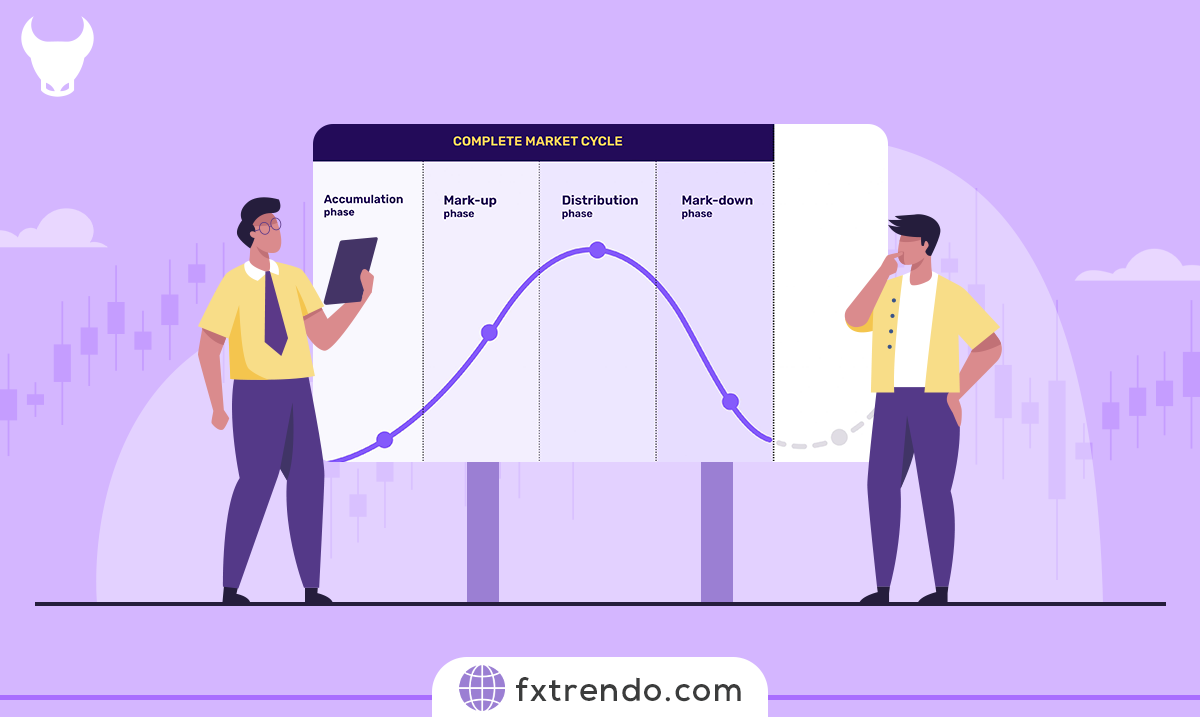
Market Cycles and Time Cycles in Technical Analysis: A Comprehensive Guide
Market cycles, one of the fundamental principles of technical analysis, play a crucial role in the success of traders. These cycles represent the repeating patterns and trends that prices follow in financial markets.
most visited

")


 in Forex & How to Use it in Trading?")
